
1 · Welcome
Trade the setups.
Use the tools.
ES / MES futures · Daily plans · Live order flow · NinjaTrader indicator
structurededgesystems.com
- A pre-market briefing before the open.
- A trading plan at 10:15, refreshed every hour.
- Setups scored, monitored and marked live: ALIVE, DORMANT, DEAD, STOPPED, TARGET.
- A live chart of gamma structure, volume profile, key levels and price, every minute.
- Order-flow gauges (delta, hedging flow, momentum), the economic calendar, a playbook and risk framework.
- An end-of-day recap with the session chart, teaching moments, and what to watch tomorrow.
- Premium: live status updates bar by bar, the invalidation checklist evaluated live, and a live notice when structure or conditions change.
Structured Edge publishes a trading plan for ES and MES futures every session. The plan is built from options positioning (where dealers are long or short gamma, where the walls are), live order flow (who is hitting the bid and the offer, where hidden size is sitting), and the day's structure (opening range, initial balance, value area, VWAP). Each trade setup carries a score, an entry, a stop, and targets, and is monitored live until it is done.
This guide walks the site from top to bottom, then shows you how to trade one of our setups, what it looks like when one fails, and how to use the same tools to find your own.
2 · Sixty-second primer
| Term | Meaning |
|---|---|
| ES / MES | E-mini and Micro E-mini S&P 500 futures. ES = $50 per point, MES = $5 per point. Same prices, same levels. |
| Long / Short | Long profits when price rises; short profits when it falls. |
| Entry · Stop · TP | Where you get in, where you get out if wrong, where you take profit (TP1 nearest, TP3 furthest). |
| Points · ticks | ES moves in 0.25-point ticks. A 6-point stop is 24 ticks = $300 on ES, $30 on MES. |
| R | Risk unit. If your stop is 6 points, +12 points is +2R. We describe outcomes in R so account size doesn't matter. |
| RTH / ETH | Regular hours 09:30–16:00 ET; everything else is the overnight (Globex) session. |
| Confluence | Independent signals agreeing. Our score counts how many, and how strongly. |
You don't need to master options theory to use the site. The regime tiles and the colour rules do the translating.
If you learn two things first, learn these: positive gamma means the tape tends to mean-revert (fade the extremes), negative gamma means moves tend to extend (trade with the break).
3 · Your trading day, hour by hour
- ~08:50: Pre-Market Briefing lands in the Working report card: bias, key levels with dealer gamma, scenarios, watch-list.
- 09:30: Open. The zone chart's price line and volume profile start; the feed pill turns green.
- 09:36 / 10:30: Opening range and initial balance form. Their levels appear when they exist, not before.
- 10:15: First operational plan and first setups. Plans refresh hourly (11:00, 12:00, 13:00, 14:00, 15:00); setups are monitored every few minutes; price, profile, and icebergs update every minute.
- 16:10: End-of-Day Recap: chart, by-time-block narrative, teaching moments, setup ledger, tomorrow.
4 · The dashboard, card by card
Header

Date, report number, last ES price, and the bias pill. The theme toggle switches dark/light and remembers your choice. Focus enters a cockpit view for one setup (section 5). Live Status (Premium) opens the live narrative.
Regime tiles

Four questions, answered at a glance:
- Regime: positive or negative gamma, and the structural flip price where it changes. Blue = positive, crimson = negative, everywhere on the site.
- Dealer positioning: net gamma exposure, delta, put/call. Big positive = dealers buy dips and sell rips. Negative = they chase.
- Flow bias (CVD): is aggressive buying or selling winning today? Signed number, updated every 10 seconds.
- Volatility regime: 30-day implied vol, its percentile, and the day's implied move in points. Wider implied move = wider stops and targets.
Price levels: gamma zone strength (the zone chart)
 123456
- 1Gamma bars: length is dealer gamma at the strike; blue positive, crimson negative
- 2Volume profile: traded volume at each 0.25-point price
- 3Price line (cyan) with the last-print dot; VWAP in purple
- 4Level tags: colour is meaning; a striped border marks a composite
- 5Key chips: hover for a definition, click to hide a layer; the 0DTE / All expiries switch sits in the Gamma bars row
- 6Toolbar: axis or inline labels, bar style, reset zoom
This is the chart you'll look at most. One price axis, five things on it:
- Gamma bars: grow from the left edge. Length = how much dealer gamma sits at that strike.
- blue = positive gamma (dealers dampen moves there)
- crimson = negative gamma (dealers amplify)
- All expiries / 0DTE toggle, in the key's Gamma bars row
- Volume profile: grows from the right edge: how much traded at each 0.25-pt price today.
- wide = acceptance, thin = passed through
- Price and VWAP
- cyan line = ES 1-minute price; white dot = the last print
- purple line = VWAP
- Key levels: dotted lines with tags on the right scale. Colour = meaning:
- red resistance · green support · amber vol trigger / flip
- purple VWAP and profile (POC / VAH / VAL) · grey structure (prior day, overnight) · light-blue gamma levels
- A tag with a striped border marks a composite: several levels at one price (
VOL TRIGGER +2); hover or tap for the members.
- Iceberg zones: light-blue bands mark hidden refills at a price: an iceberg is a large resting order that keeps reloading.
ICEBERG SUP ×22= 22 refills on the bid side;RES= the ask side;2-SIDED= both

The key is clickable. Hover a chip for its definition; click to hide that layer. Your choices are remembered.
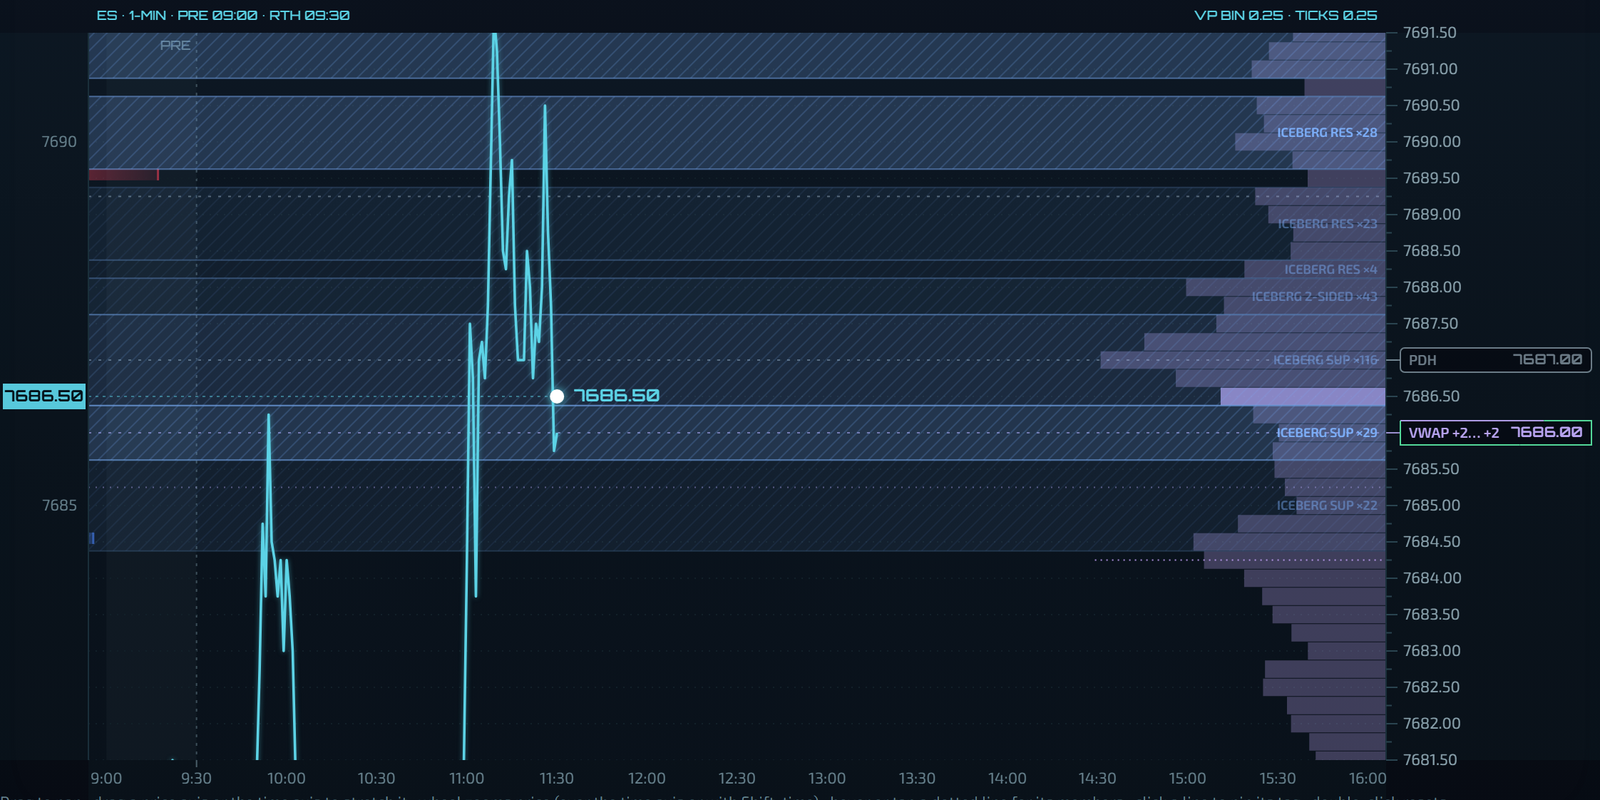
Scroll to zoom price, scroll over the time axis to zoom time, drag to pan, drag an axis to stretch it, double-click to reset. The default view is the expected move ± 50 points.
Intraday flow: CVD
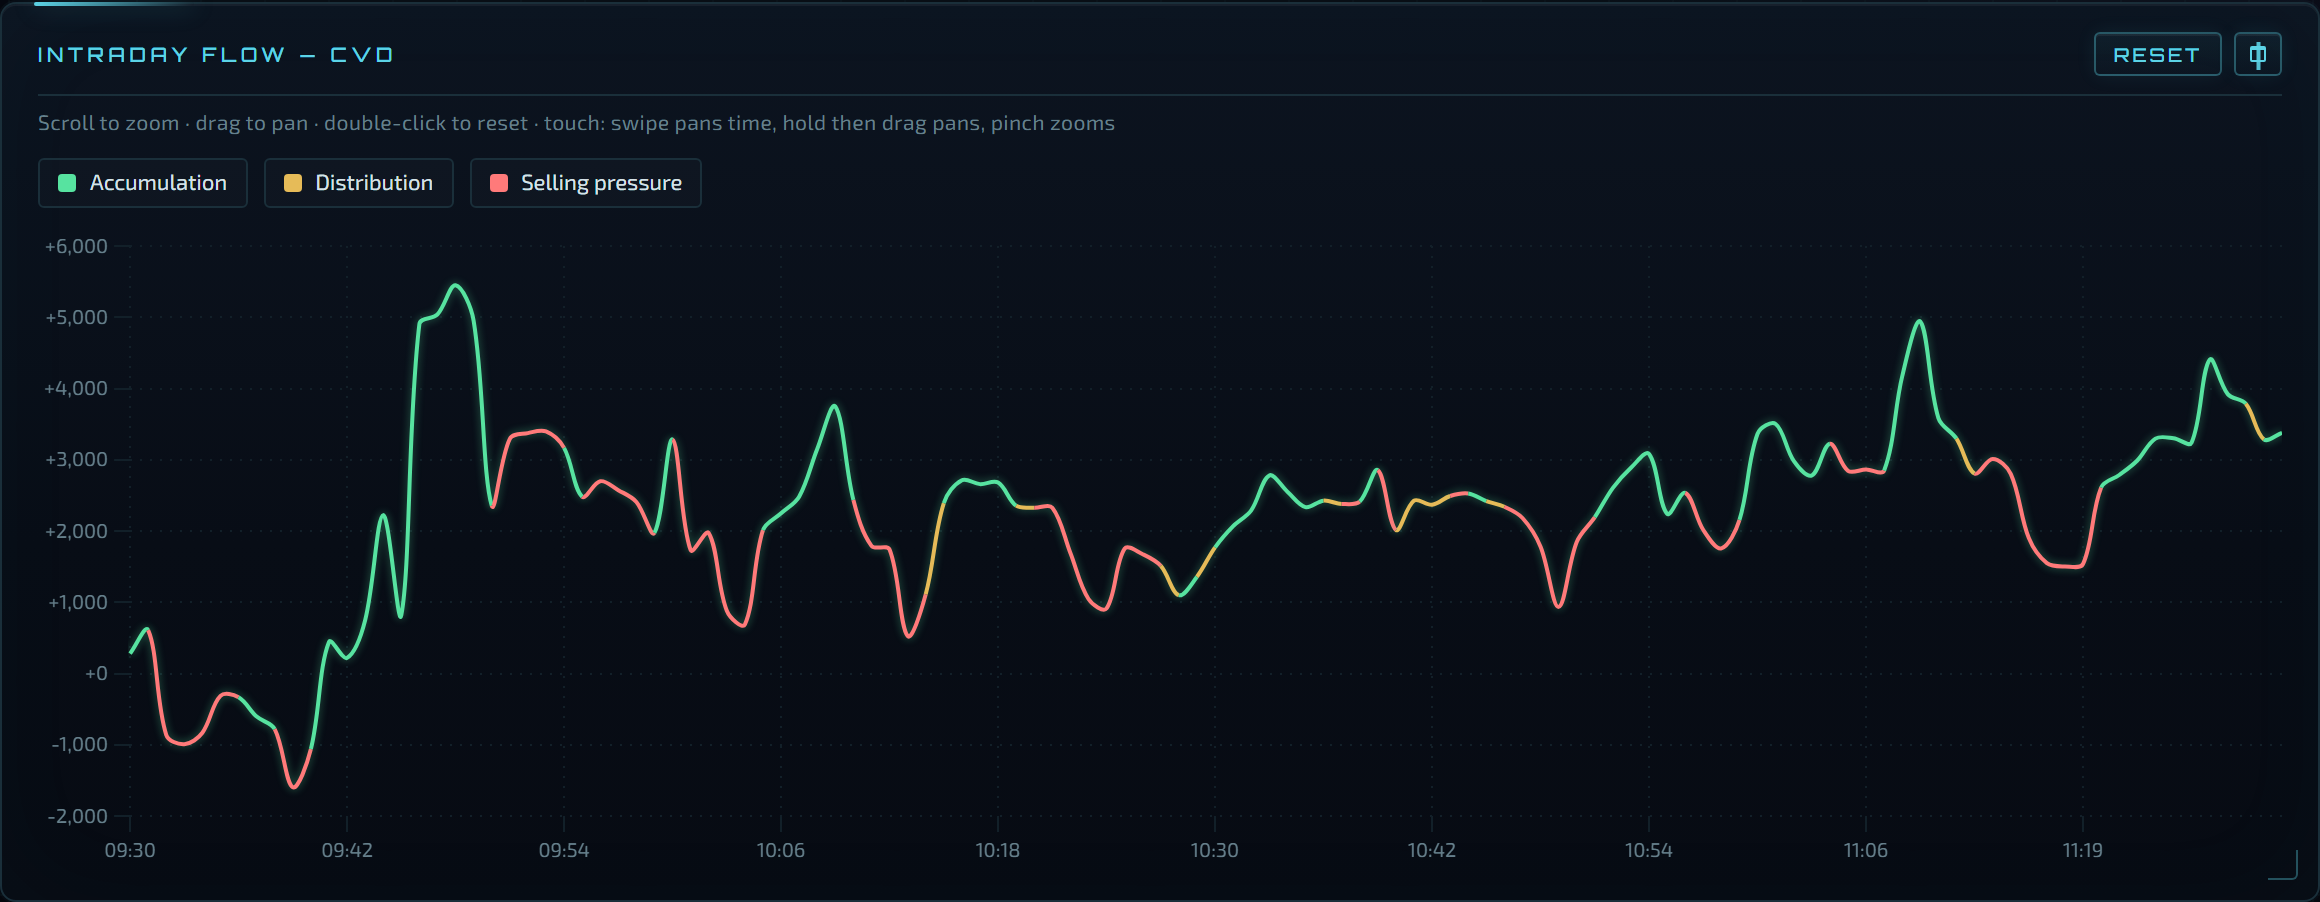
Cumulative volume delta since 09:30: buying minus selling. Rising = buyers in control. Watch for divergence: price making a new high while CVD doesn't is a warning.
Hedging impact of options
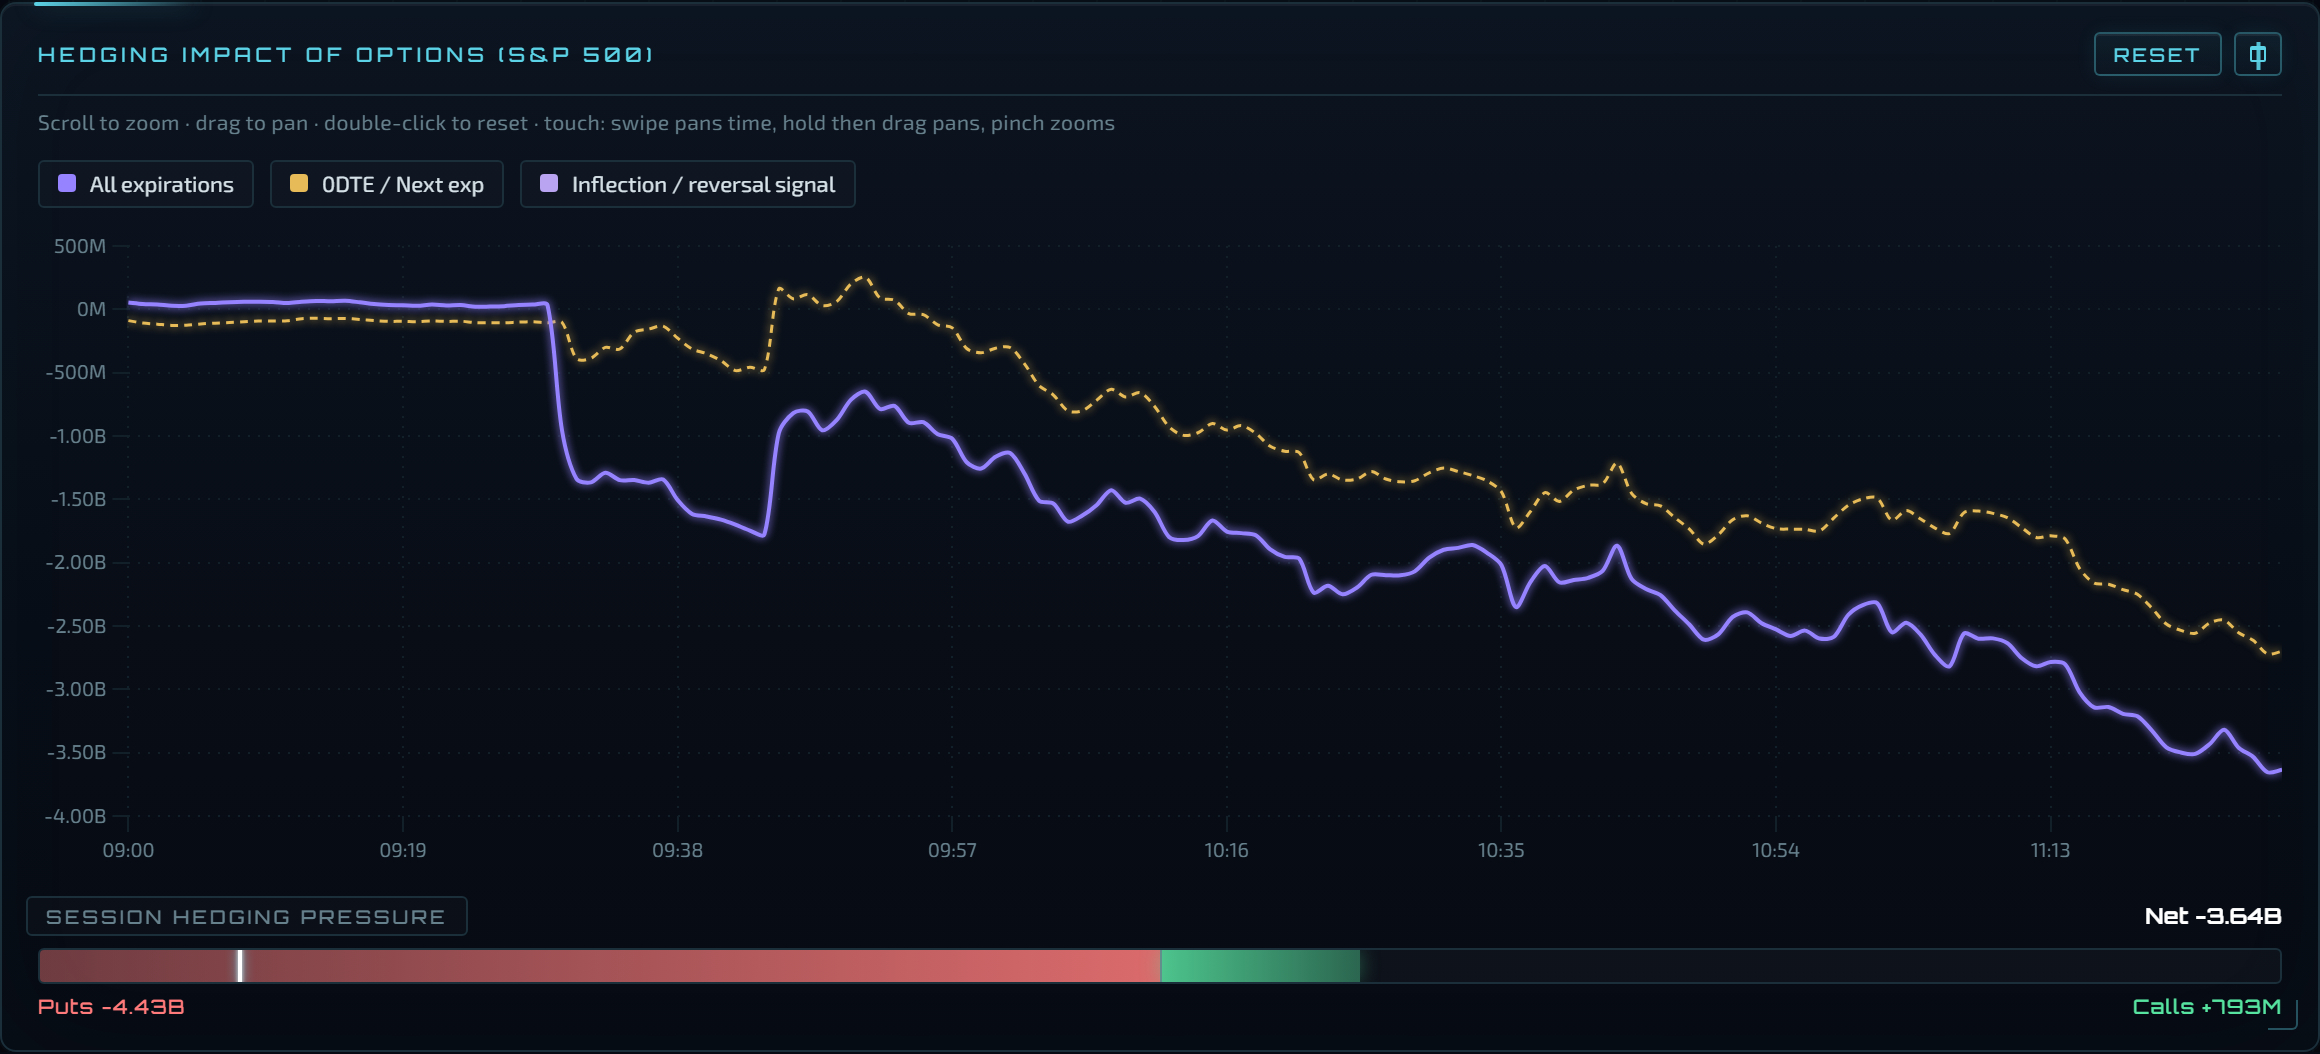
How dealers are hedging in real time: violet = all expiries, amber dashed = 0DTE. Both rising = hedging is buying (supportive); both falling = selling.
Net gamma exposure by price
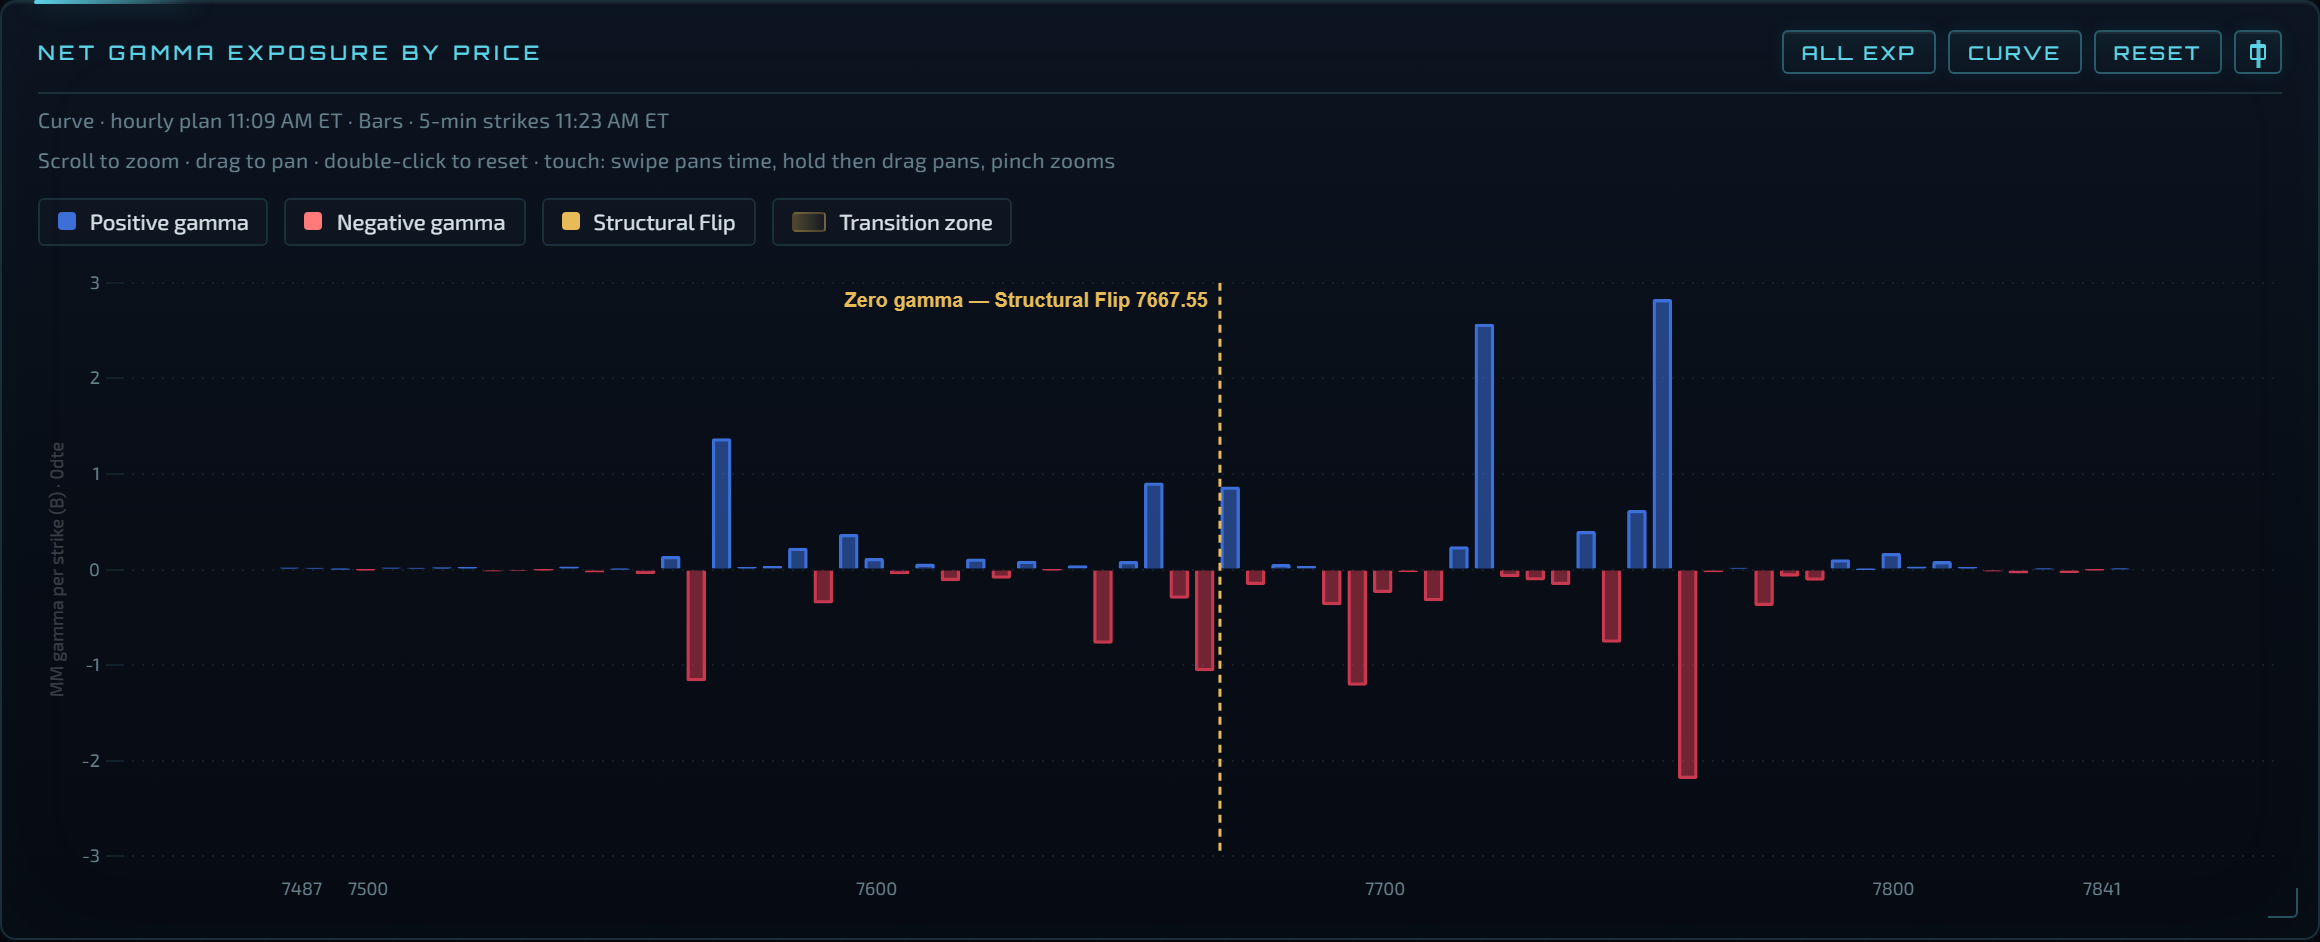
The same gamma as the zone chart, as a curve or bars by strike, with the flip. Use the 0DTE toggle to see today's expiring positioning on its own.
Momentum
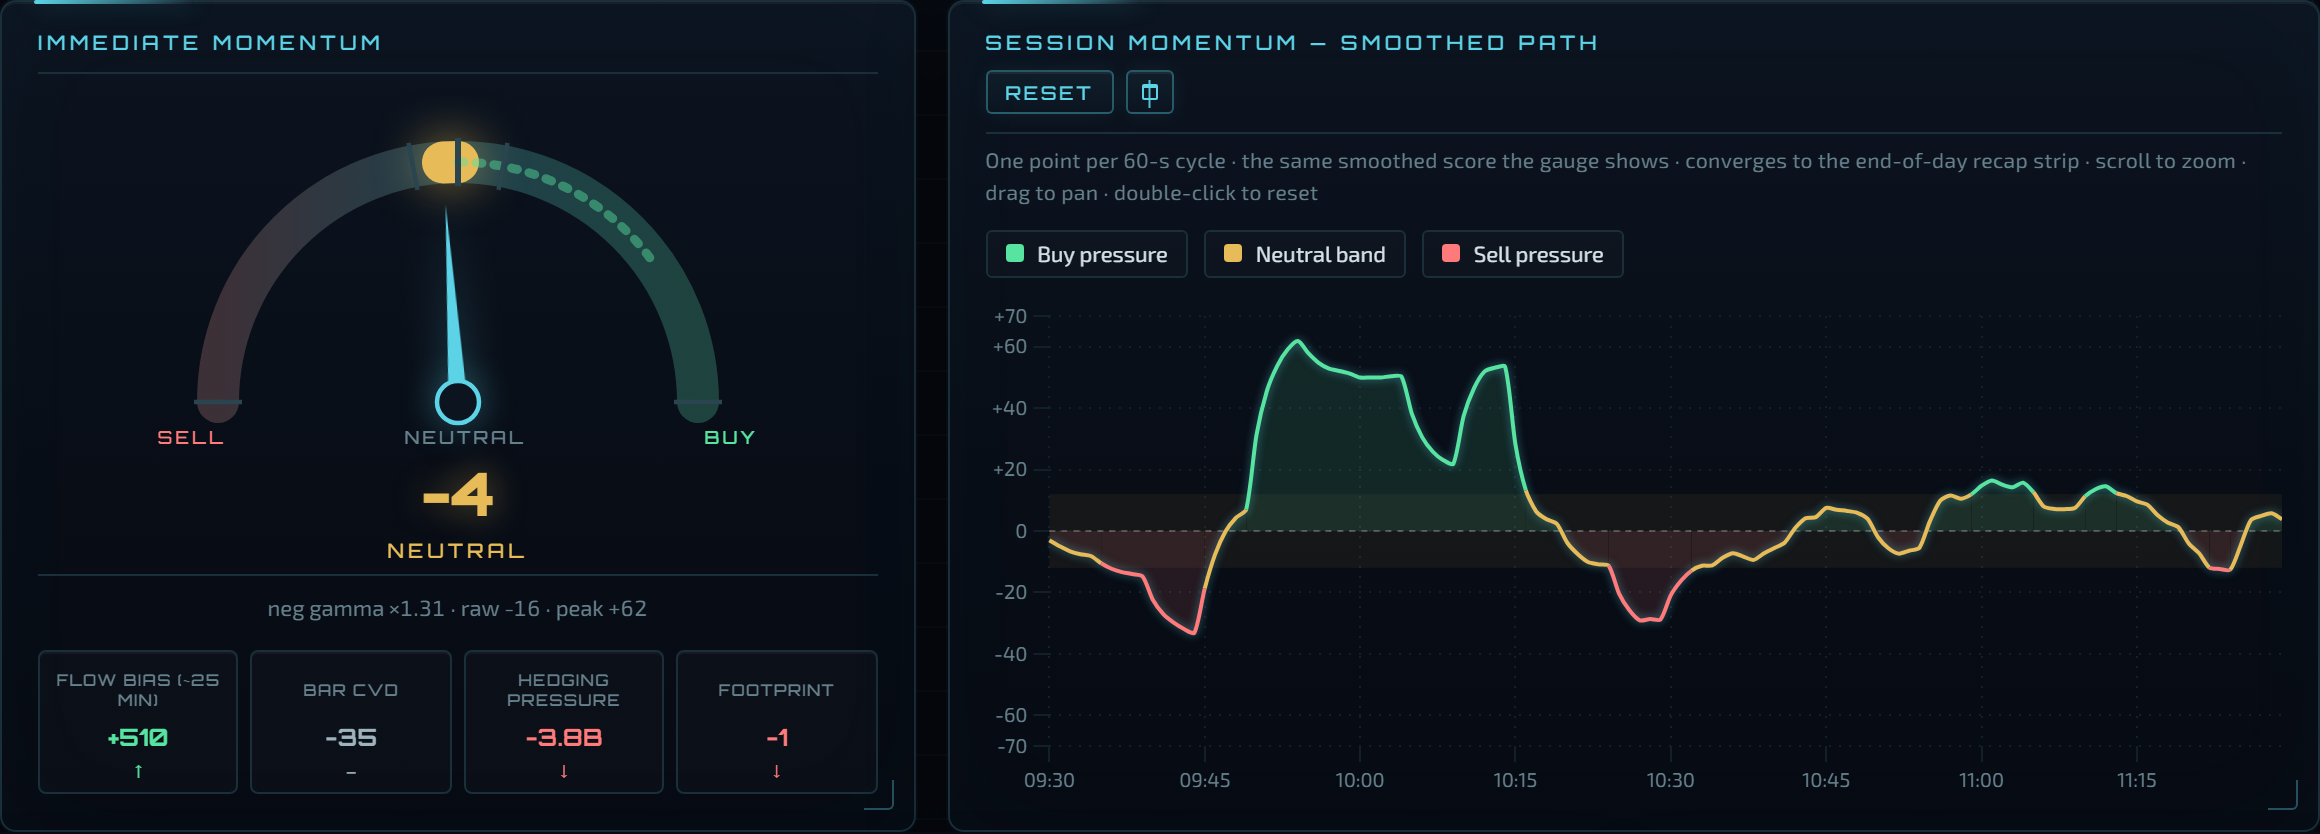
The gauge is now; the path is the session. State words (rising, fading, falling) match the colour. A zero-cross on the path is often where a move turns.
Working report
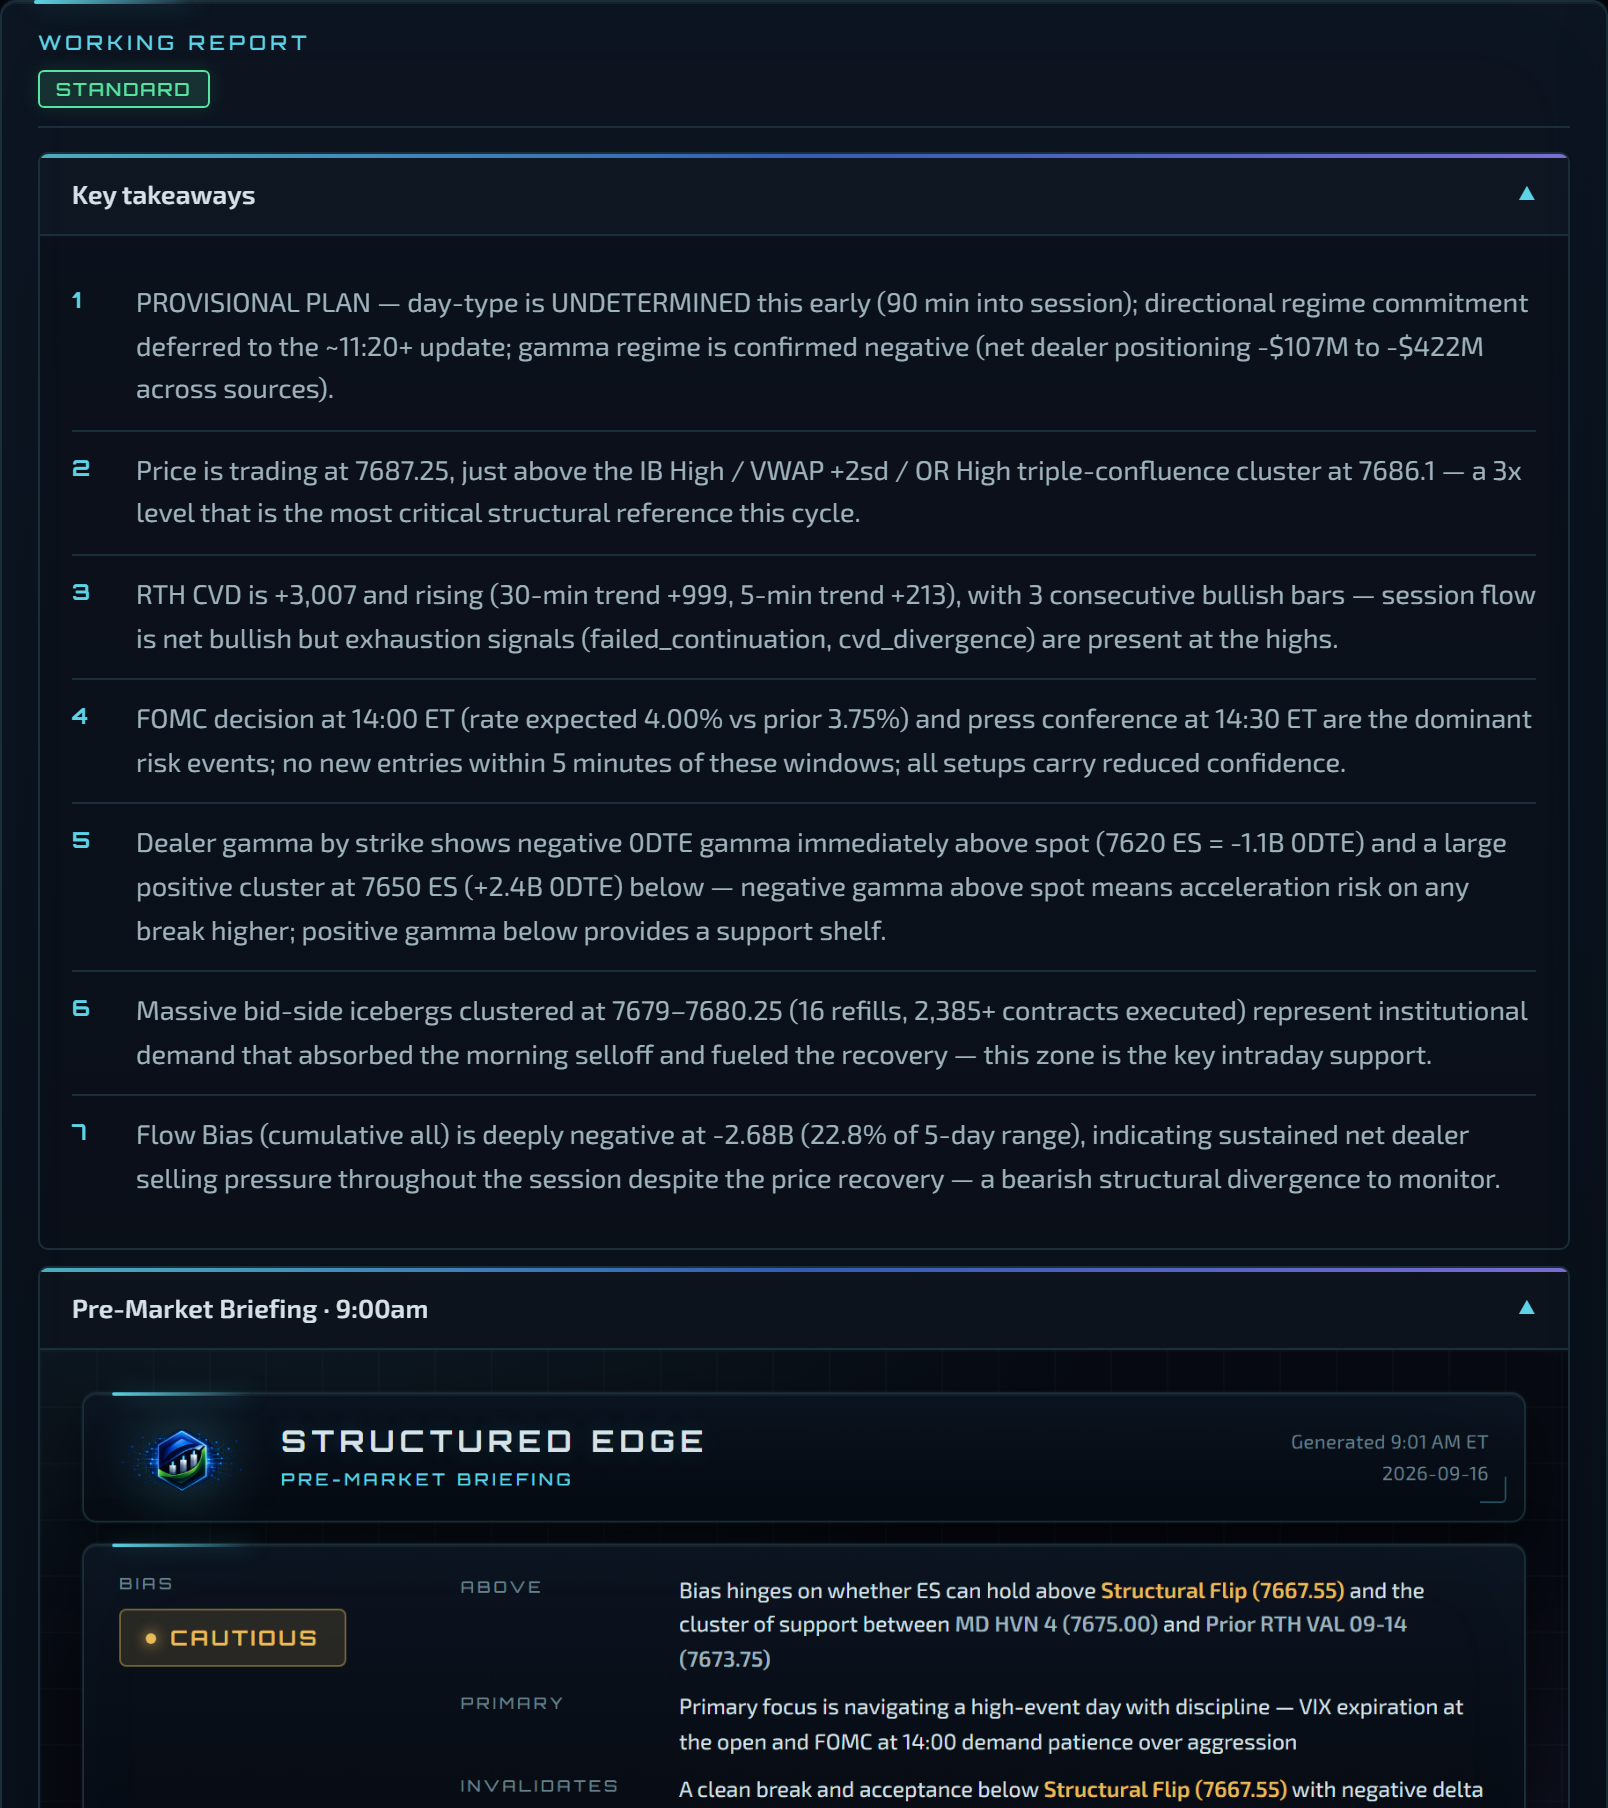
Key takeaways, the Pre-Market Briefing image (section 9), session updates, the Opening Range report (OR/IB/VWAP/implied-move tiles once they exist), and the End-of-Day Recap block (section 10).
Live status update Premium
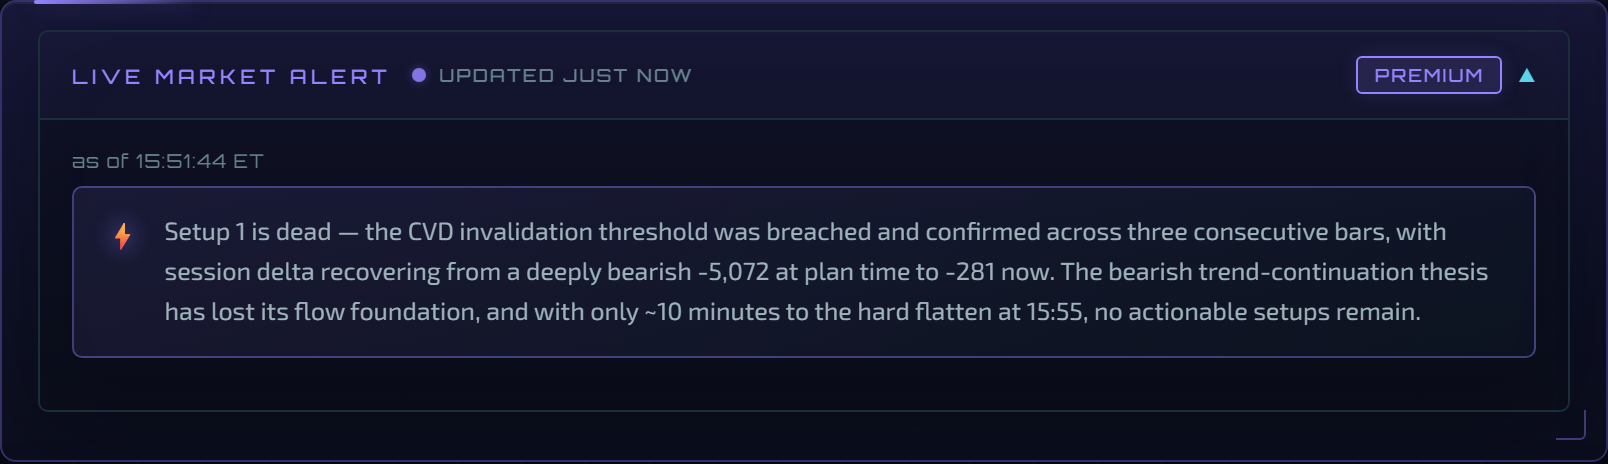
A written read of the tape, updated every few minutes, with a WATCH box when something needs attention (an iceberg cluster in the way of a target, for example).
Trade setups
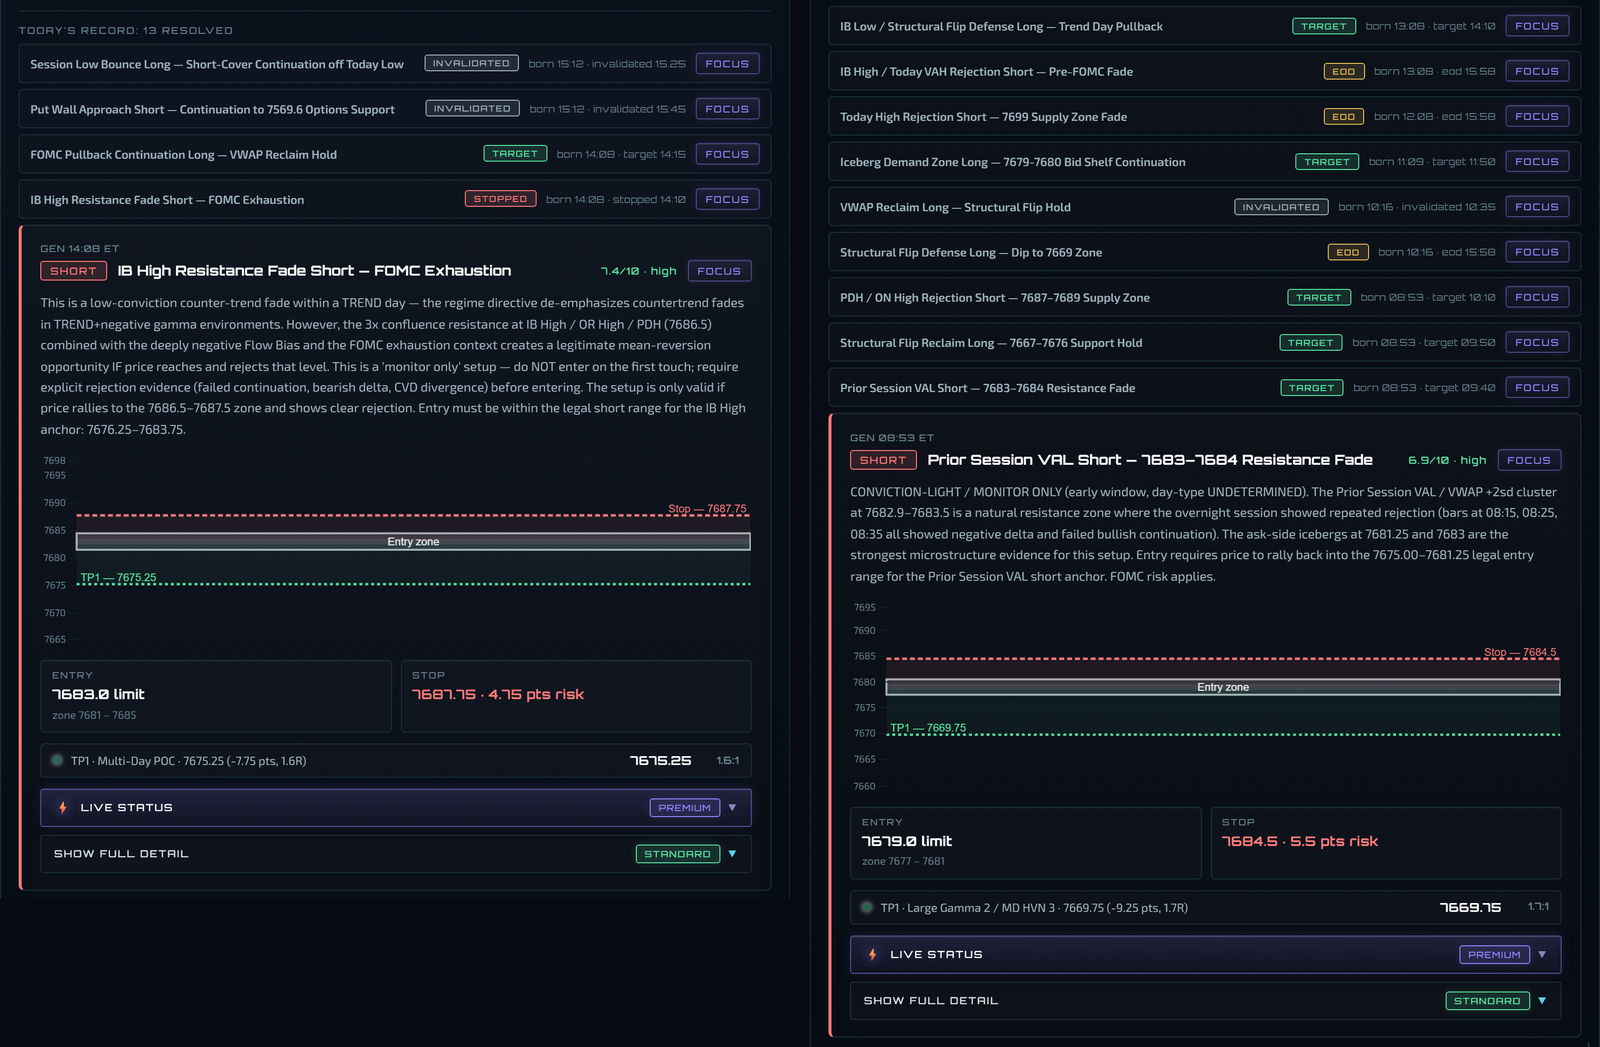
The board. Status or chronological order. Each card is a setup (section 5). Resolved setups drop into the ledger below.
Economic calendar
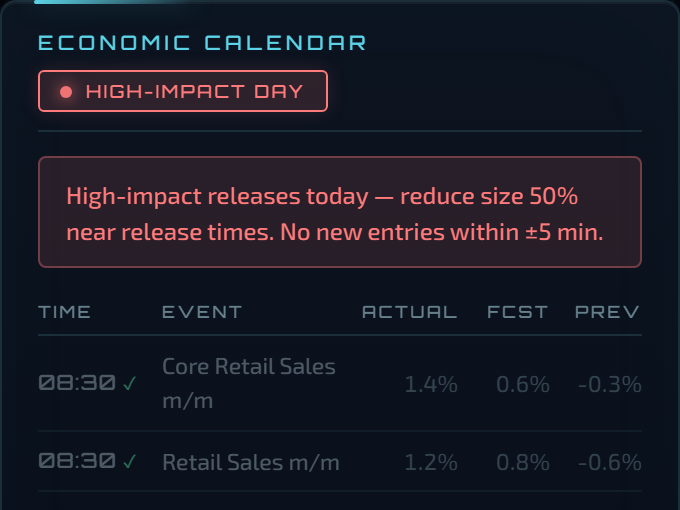
Today's releases with impact. Passed events dim with a check; the next one is highlighted. Avoid new entries in the minutes around a high-impact release.
Levels ladder
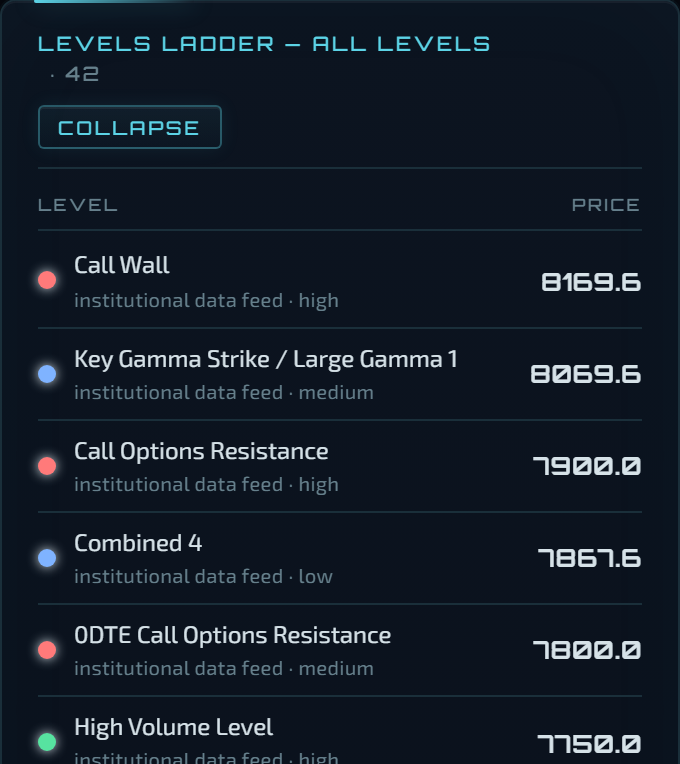
Every published level, ranked, with strength. Collapsed by default because the chart already shows the important ones; expand it for the full list.
Playbook · Risk framework
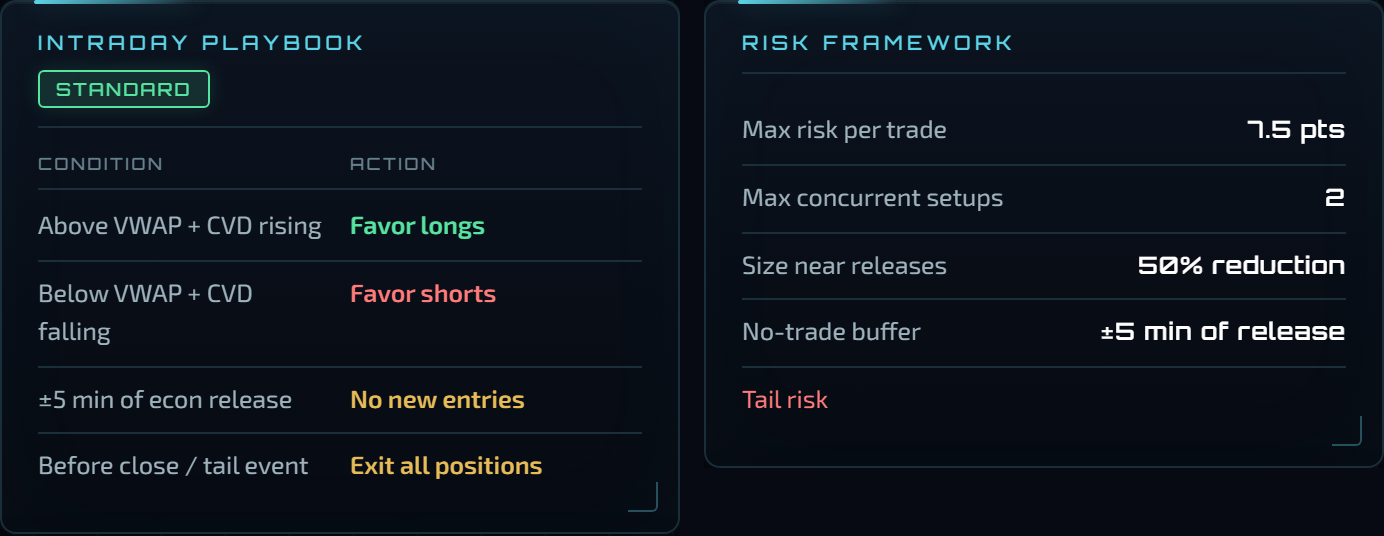
The session's standing rules (what to do above/below the trigger, around releases, into the close) and the risk framework (max risk per trade, concurrent setups, size near releases). Follow these before you follow a setup.
Downloads · Indicator downloads · All subscribers
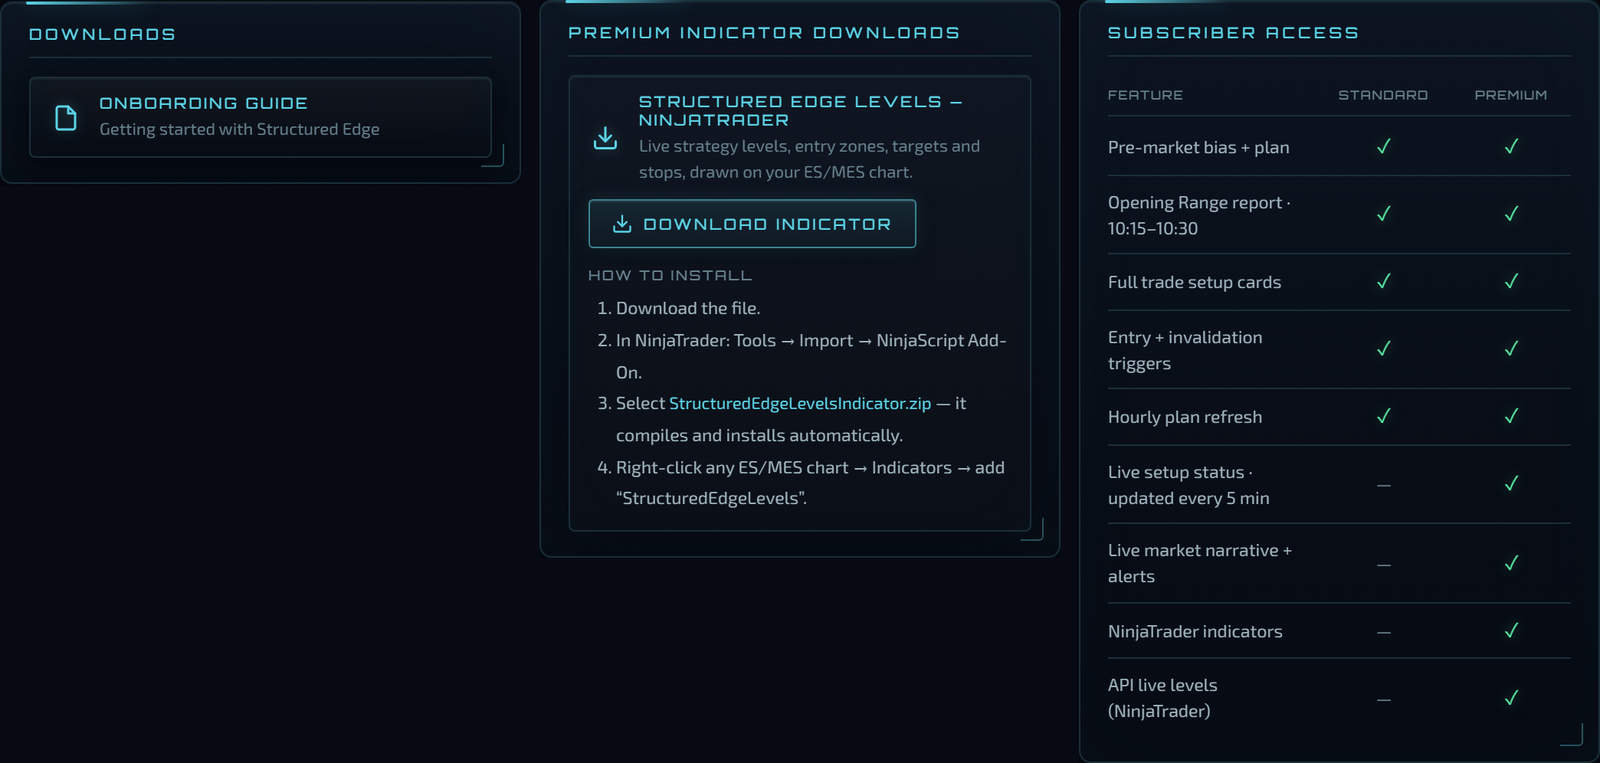
This guide, the NinjaTrader indicator (section 11), and the Standard vs Premium table.
5 · Reading a setup card
 12345678910
- 1Name and direction, the anchor level, the idea in one line
- 2Confluence score out of 10
- 3Generated and revised times
- 4Thesis: read this first
- 5Geometry: entry zone, stop and targets against price
- 6Entry and stop, with points and R
- 7Targets TP1 to TP3
- 8Live status pill
- 9Invalidation checklist: the conditions the monitor watches
- 10Focus
- Name and direction:
LONG/SHORT, the anchor level, and the idea in one line. - Score: confluence out of 10. 8+ exceptional, 6–8 high, 4–6 medium, below 4 low.
- Thesis: why. Read this before anything else.
- Geometry: drawn on a price scale: entry zone, stop and targets; Focus shows them against live price on the zone chart.
- Entry · Stop · TPs: with points and R.
- Live status: the pill that matters:
| Pill | Meaning | What you do |
|---|---|---|
| Alive | Conditions hold; the setup is valid. | Watch for the entry. |
| Dormant | Not invalidated, but a precondition isn't met yet. | Wait. Don't force it. |
| Dead | An invalidation condition fired. | Don't enter. It won't come back. |
| Stopped Target | The trade ran and hit its stop or a target. | It's done; read the outcome. |
- Invalidation checklist: the exact conditions the monitor watches. A red ✕ with a time is what killed it.
- Revised: a live setup can be tightened by a later plan (entry, stop, targets). Dead setups are never revised. If the same idea comes back with different conditions it's a new card with a note: re-proposal of L…_N (killed HH:MM), conditions changed.
- Focus: pins the card beside the zone chart zoomed to its entry/stop/targets, with the invalidation checklist and the flow charts alongside.
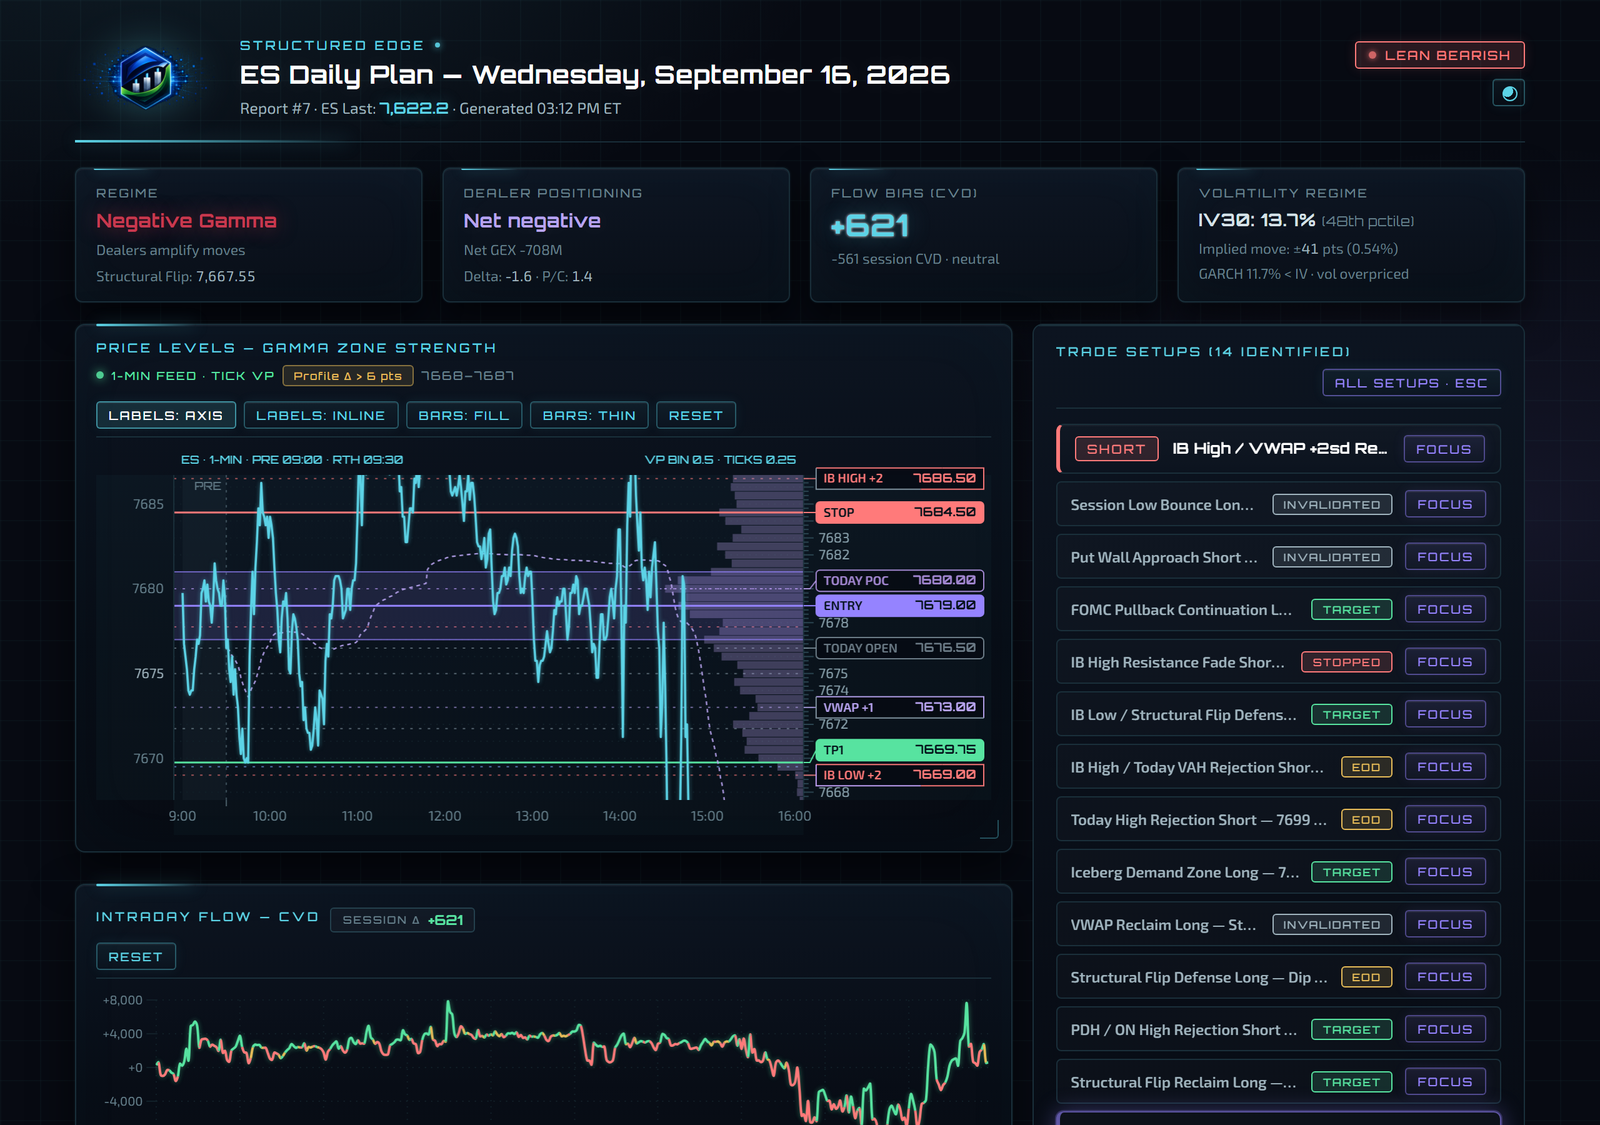
6 · Trading a setup: a worked exampleFriday 4 September 2026
Iceberg Supply Rejection Short: 7740 VWAP Resistance, published 08:53, score 6.0.
-
Read the thesis. Offers kept refilling at 7740–7747 (an iceberg at VWAP), and the plan expected supply to hold. Short 7738, stop 7742 (4 points, 1R), TP1 7734.25 (about 1R).
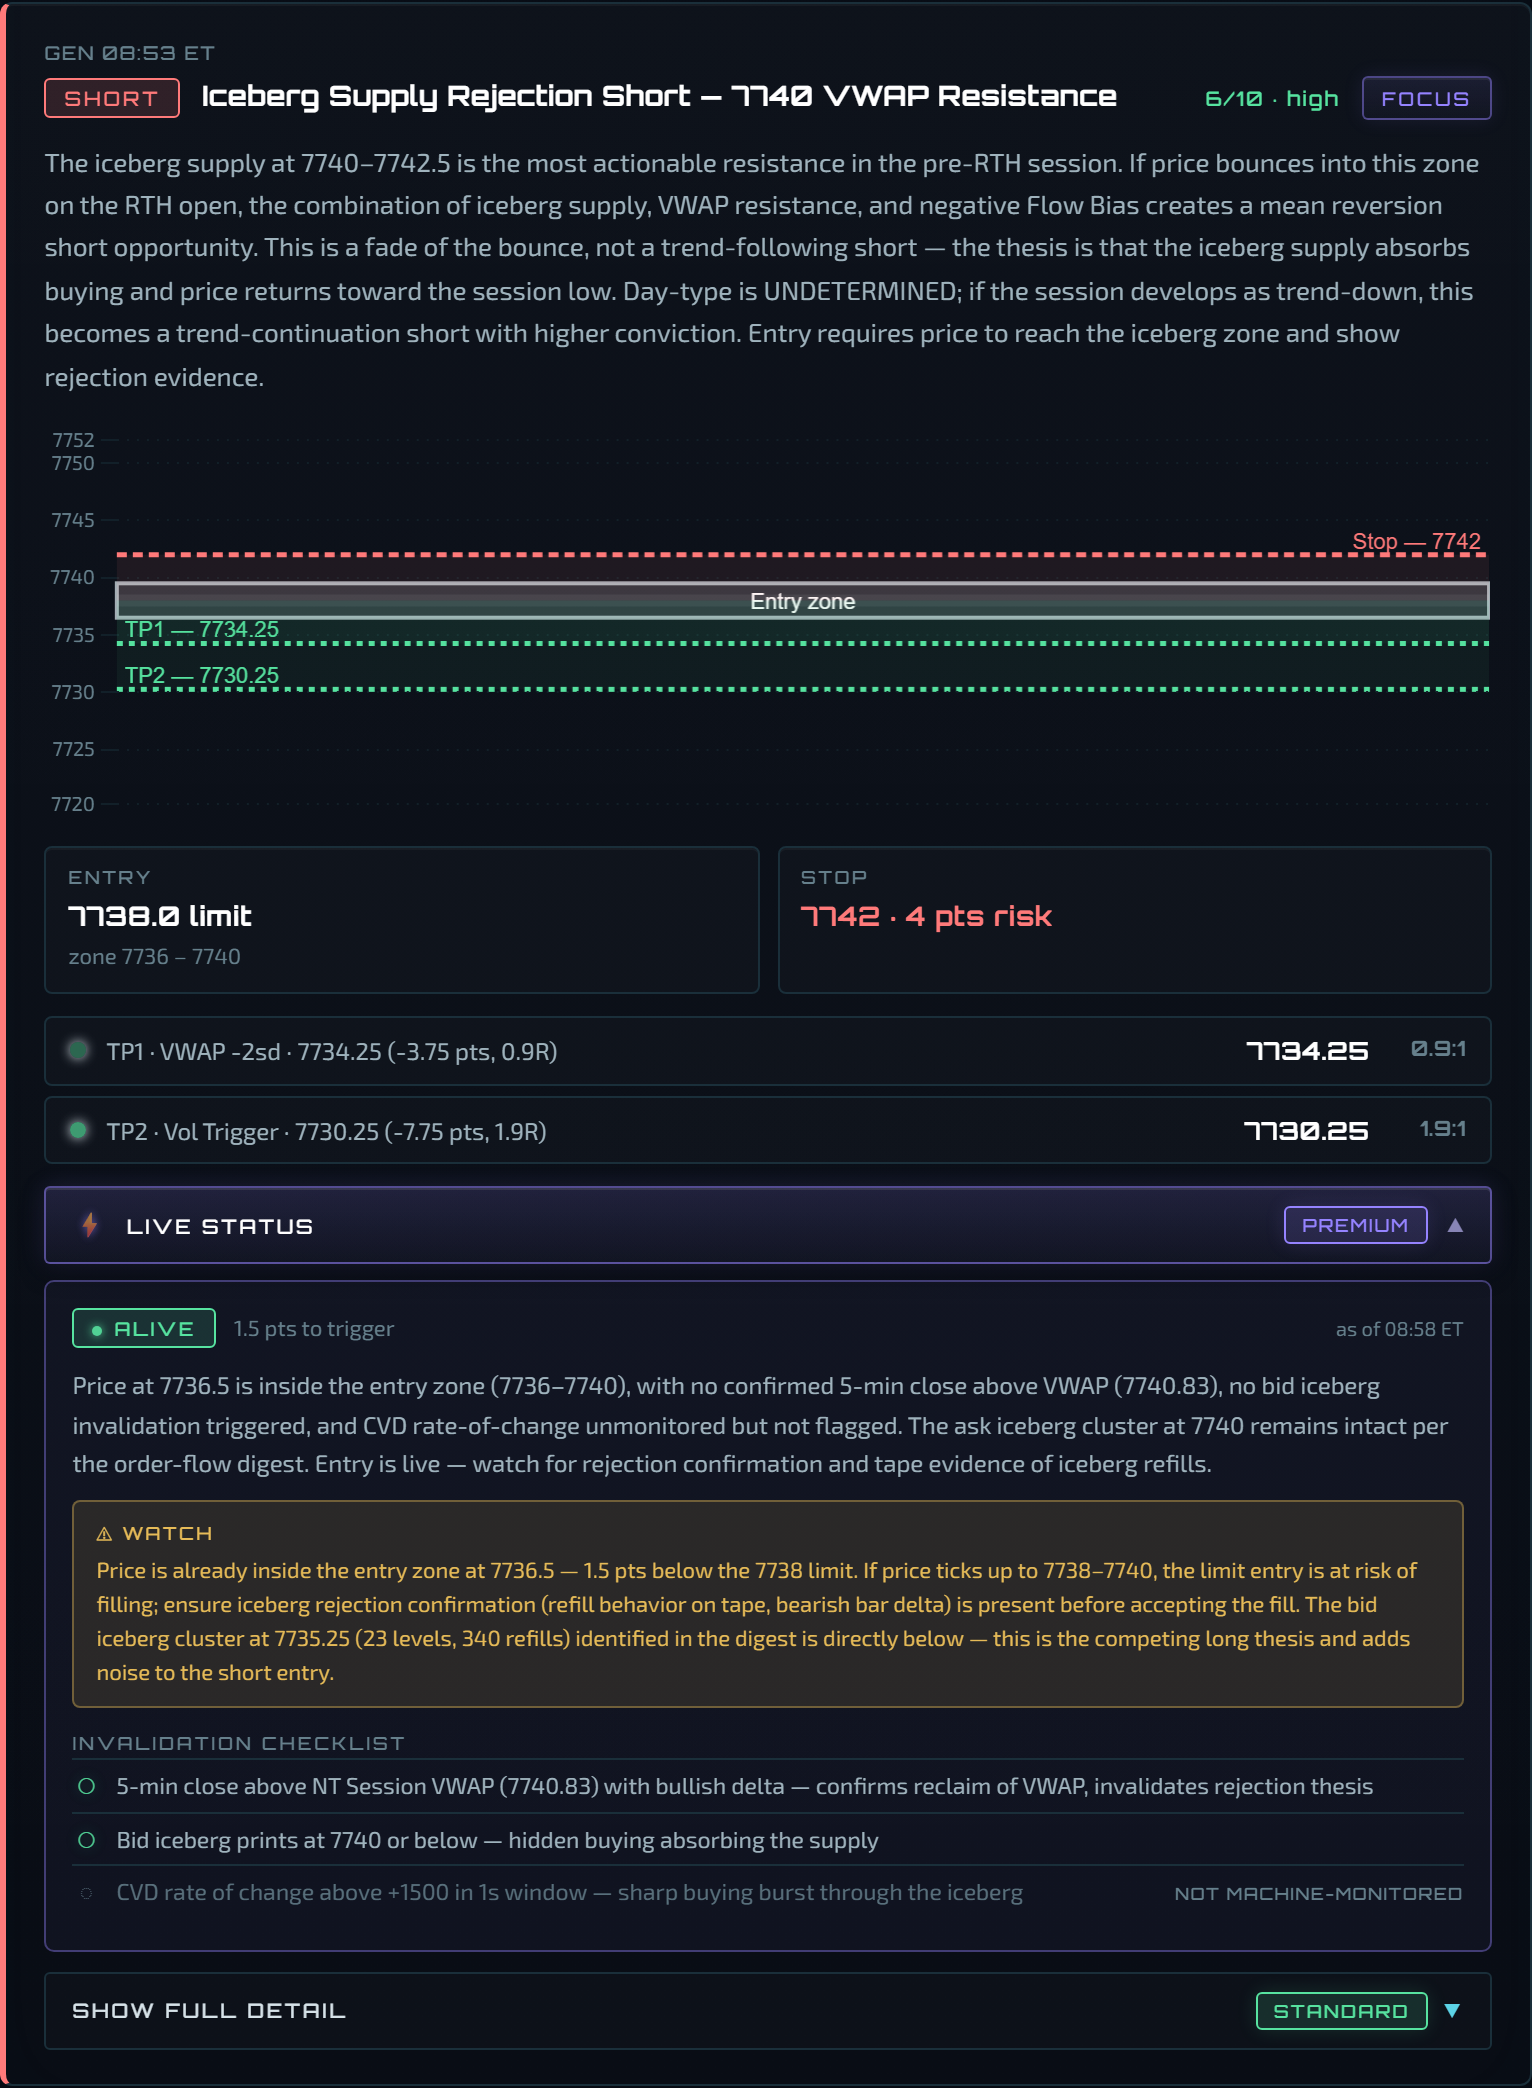
Fig. 2008:58, the monitor's first read: ALIVE, 1.5 pts to trigger. Thesis, entry 7738 limit, stop 7742 (4 pts risk), TP1 7734.25. -
Check the chart. The VWAP tag where the thesis says, an iceberg band at the offer just above it, price under VWAP. Confluence is visible, not just scored.
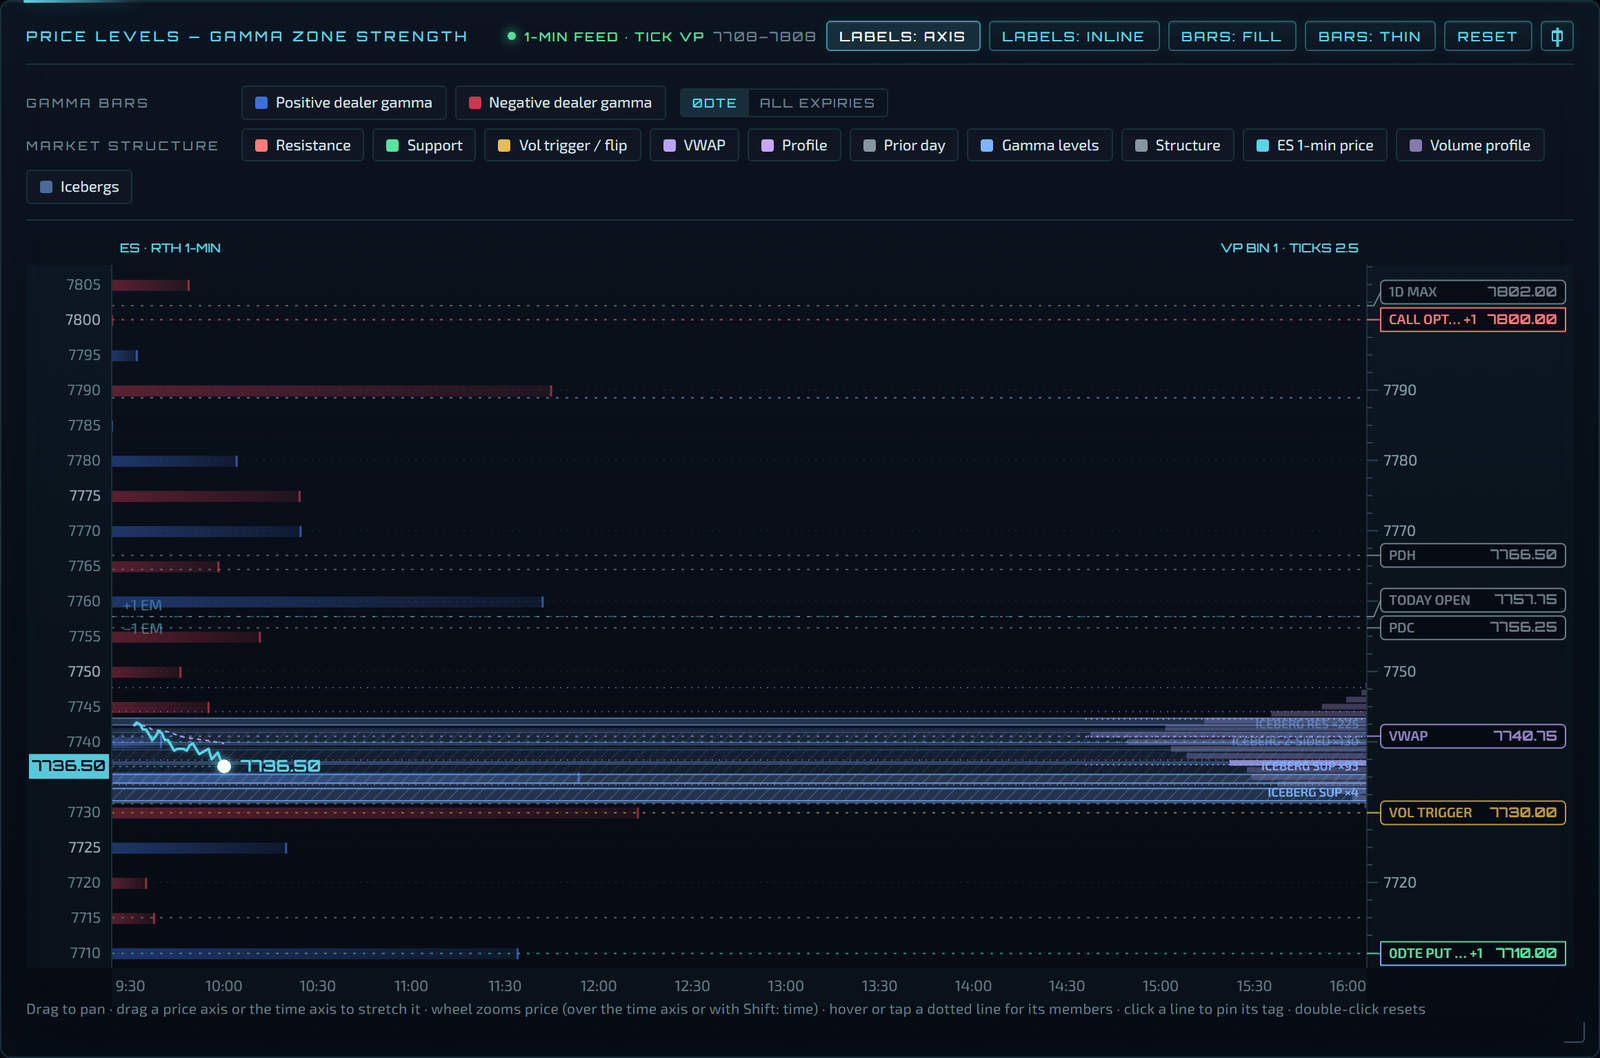
Fig. 2109:00, the zone chart: the VWAP tag at 7740.75, the iceberg resistance band just above it, price at 7736.50 below both. Price path and volume profile illustrative: one-minute data for this session was not archived; levels, gamma bars and iceberg zones are the day's. -
Know what kills it. The checklist is your exit plan before you're in.
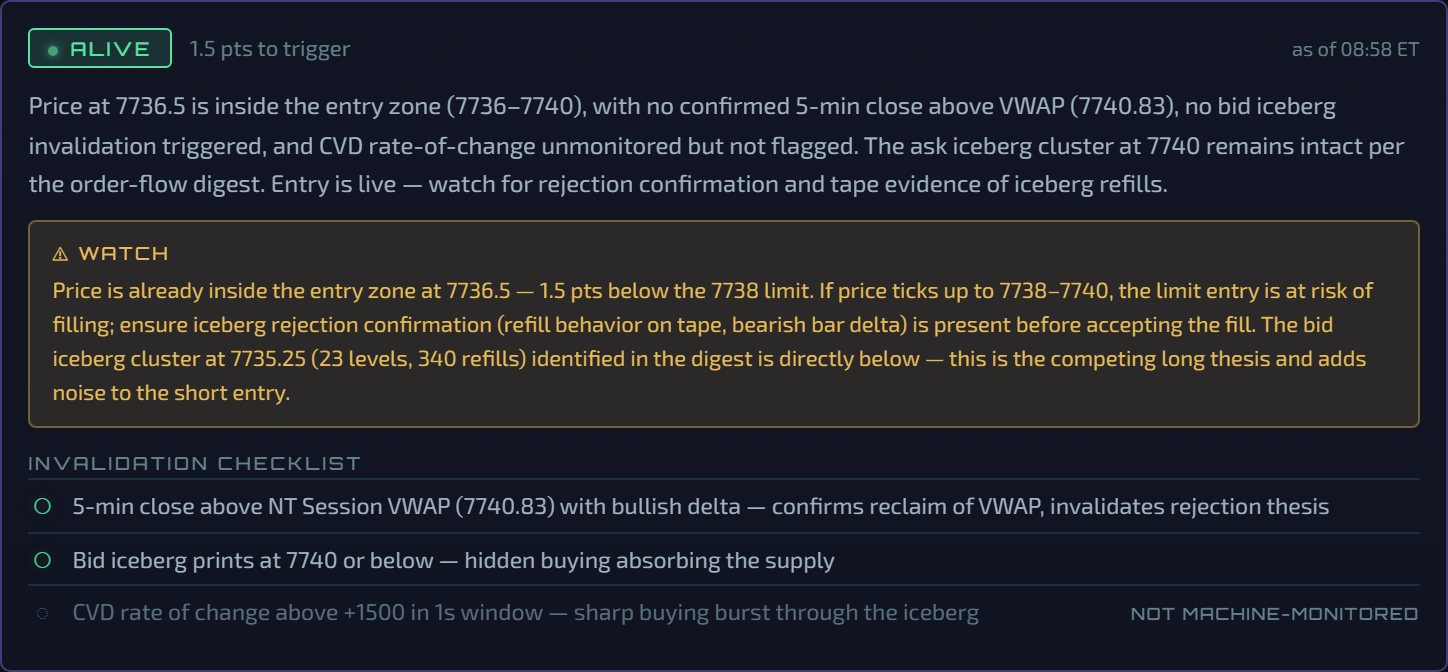
Fig. 2208:58, the invalidation checklist: a 5-min close above VWAP with bullish delta, bid iceberg prints at 7740 or below, and a CVD burst the monitor does not machine-check. -
Trade it. Entry was met at 08:55 and TP1 traded at 09:05, +3.75 points (+0.9R on the stated stop). On the same read the monitor saw a bid iceberg under the level and marked the thesis dead, but the trade was already at target. The playbook's management (scale at TP1, stop to entry, let a runner try TP2) is yours to apply; the card grades to the first target so the record is conservative.
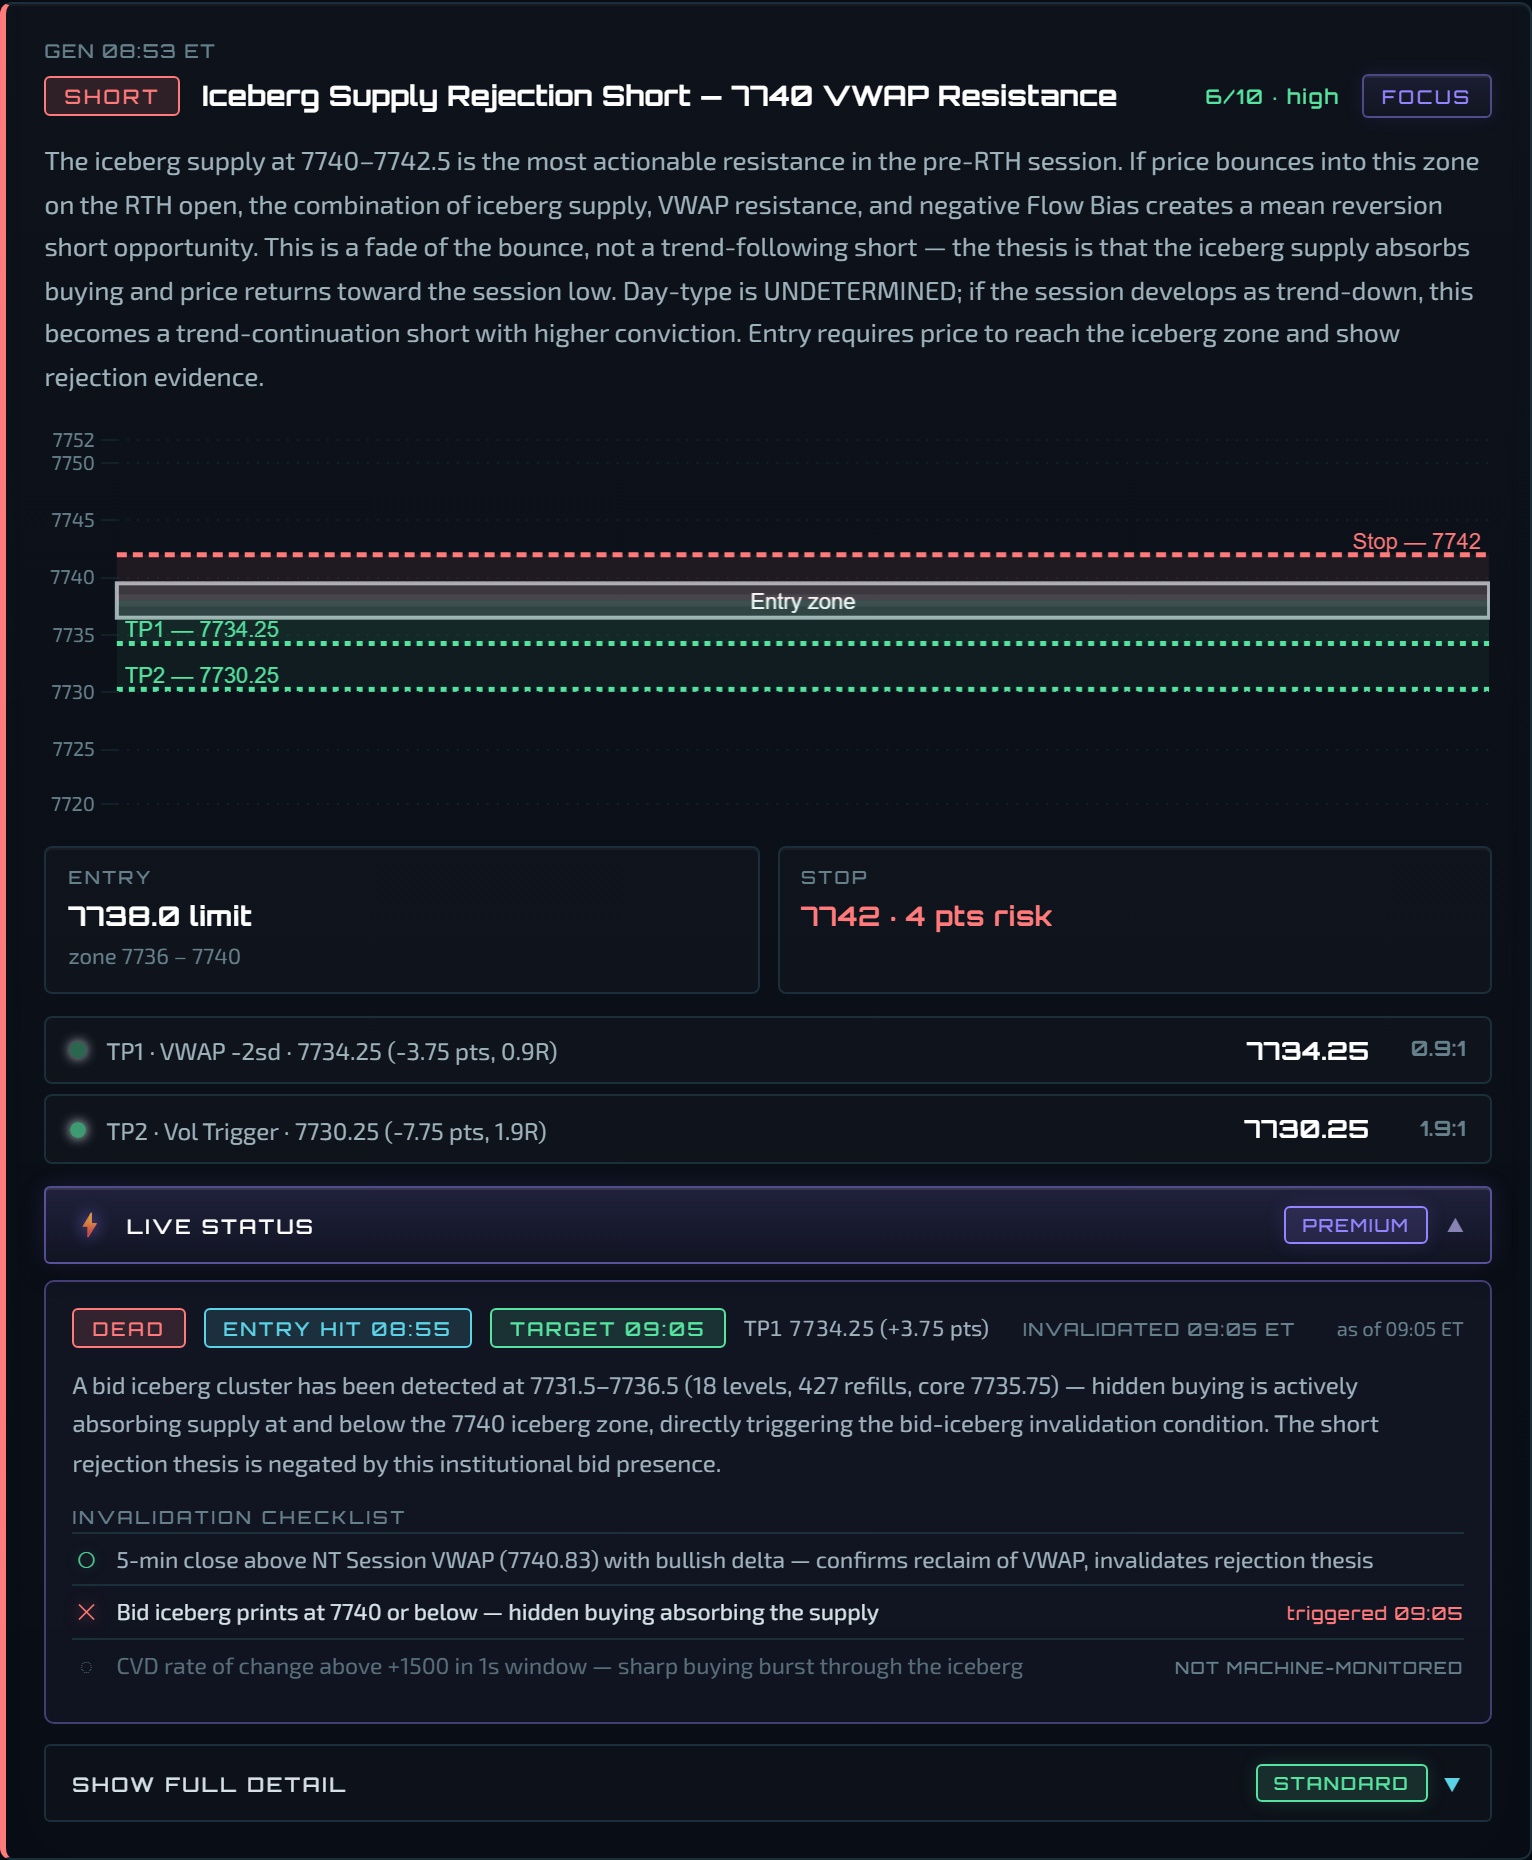
Fig. 2309:05, ENTRY HIT 08:55, TARGET 09:05 · TP1 7734.25 (+3.75 pts). The same read also fired the bid-iceberg condition, so the card closed DEAD with the target outcome beside it. -
Close the loop. In the evening recap the setup appears in the ledger with its outcome, and the chart shows the ① iceberg at VWAP that made the trade.

Fig. 24The setup's row in the evening recap ledger: published 08:53, trigger met 08:55, target hit 09:05.
7 · When a setup dies: a second exampleTuesday 8 September 2026
Failed Balance Breakout Short: Today Open / PDL Rejection, published 12:09.
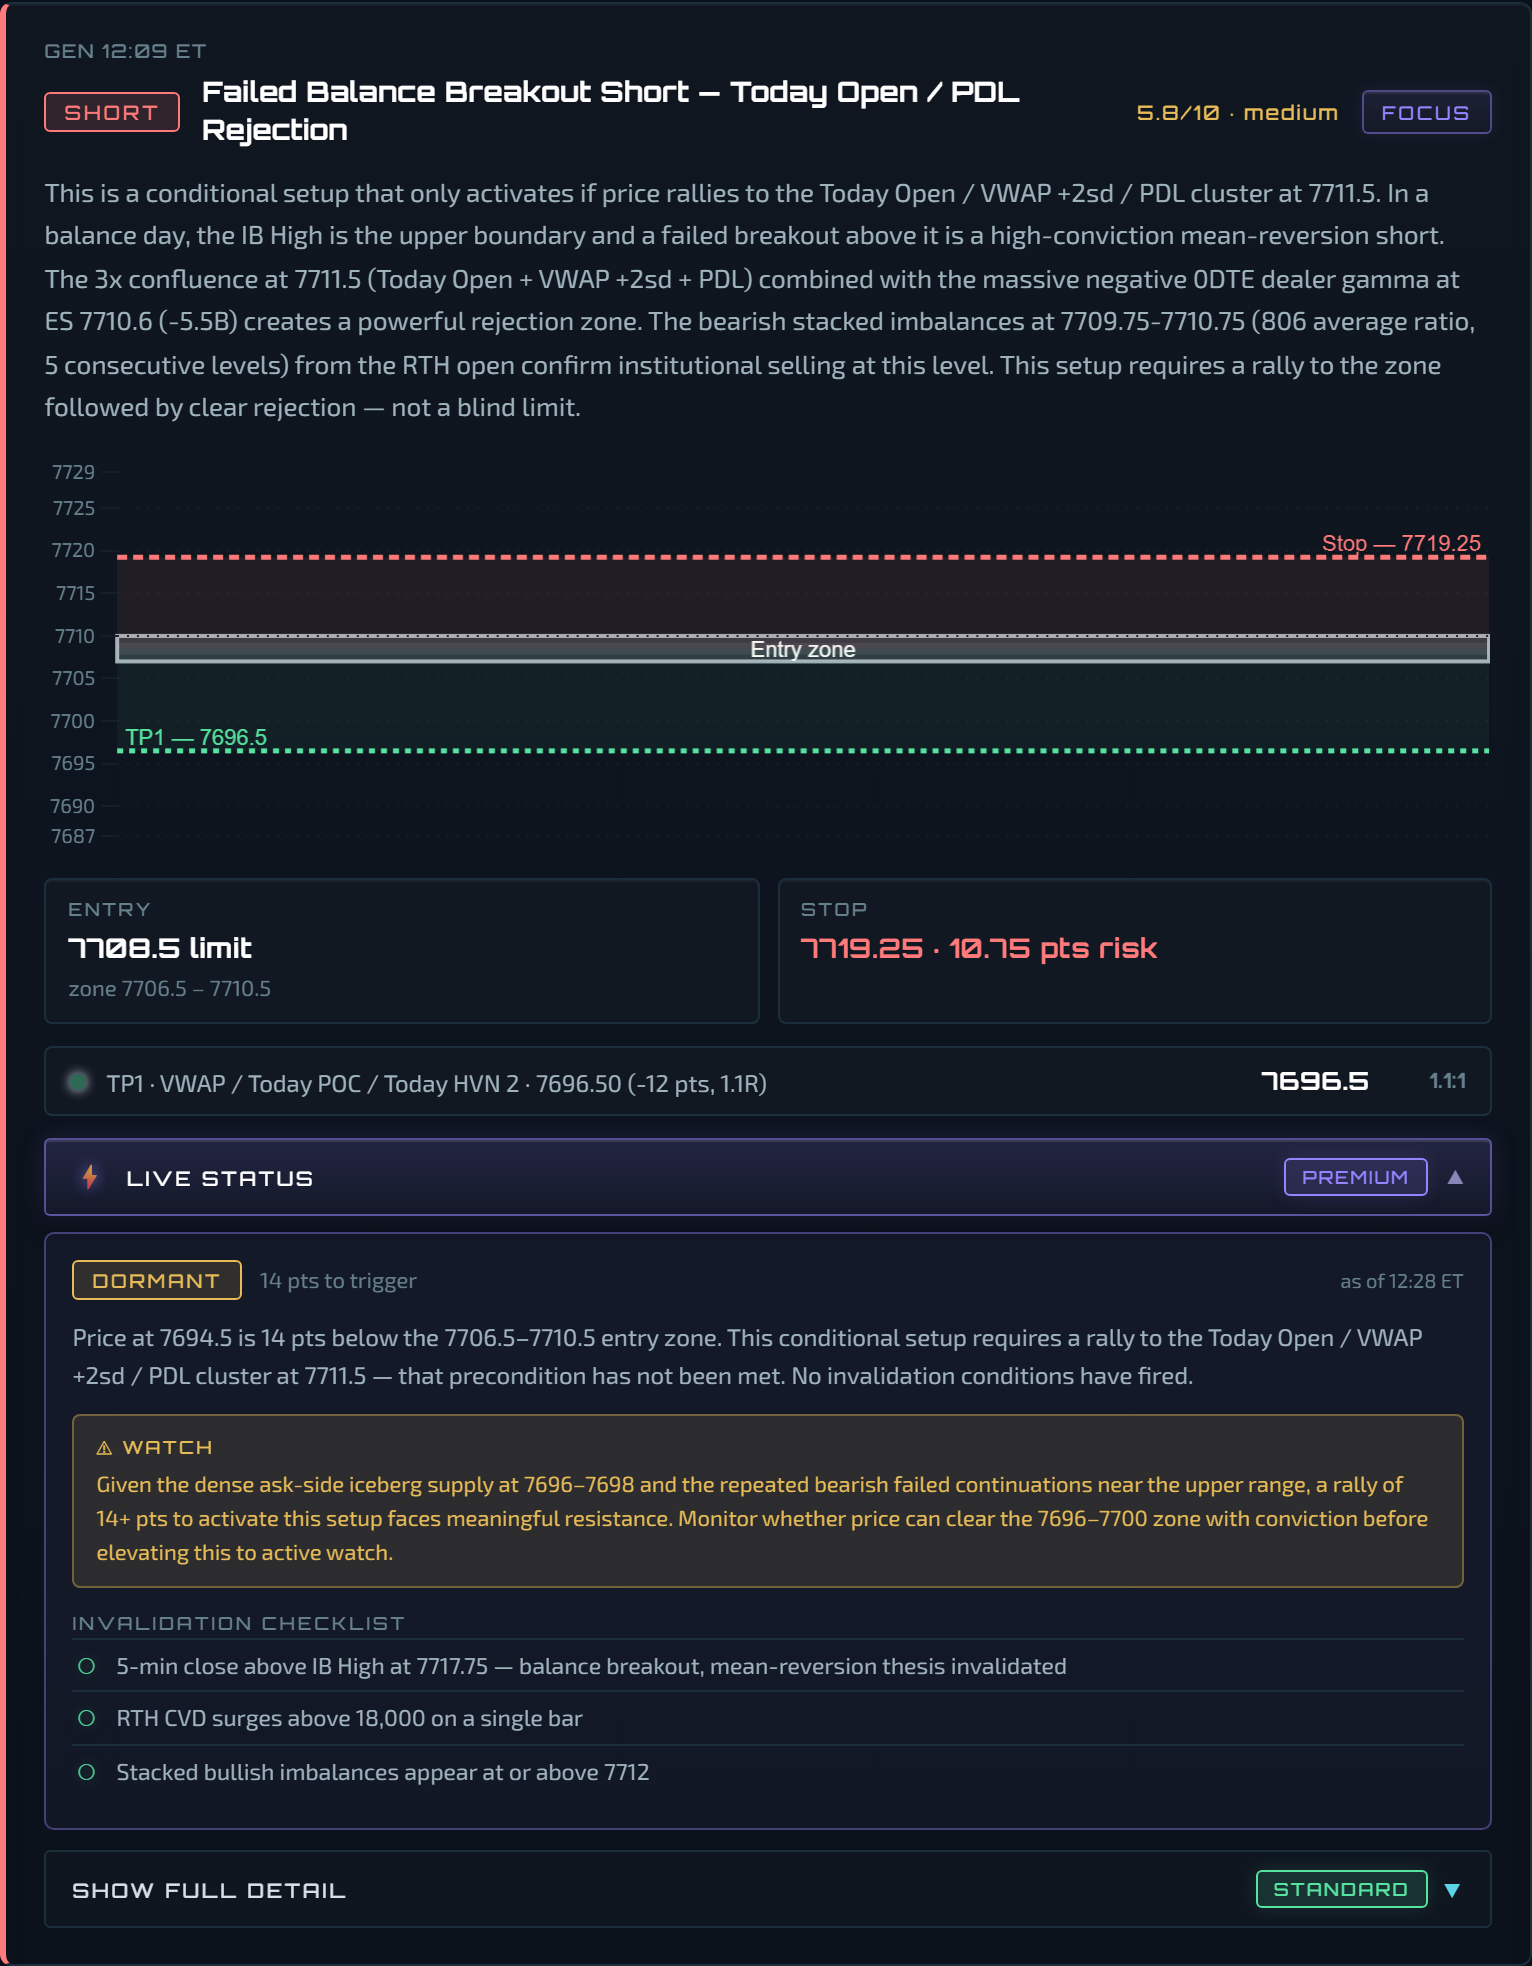
The short was dormant at 12:30: not invalidated, but its precondition (a rally to the 7711.5 cluster) hadn't been met.
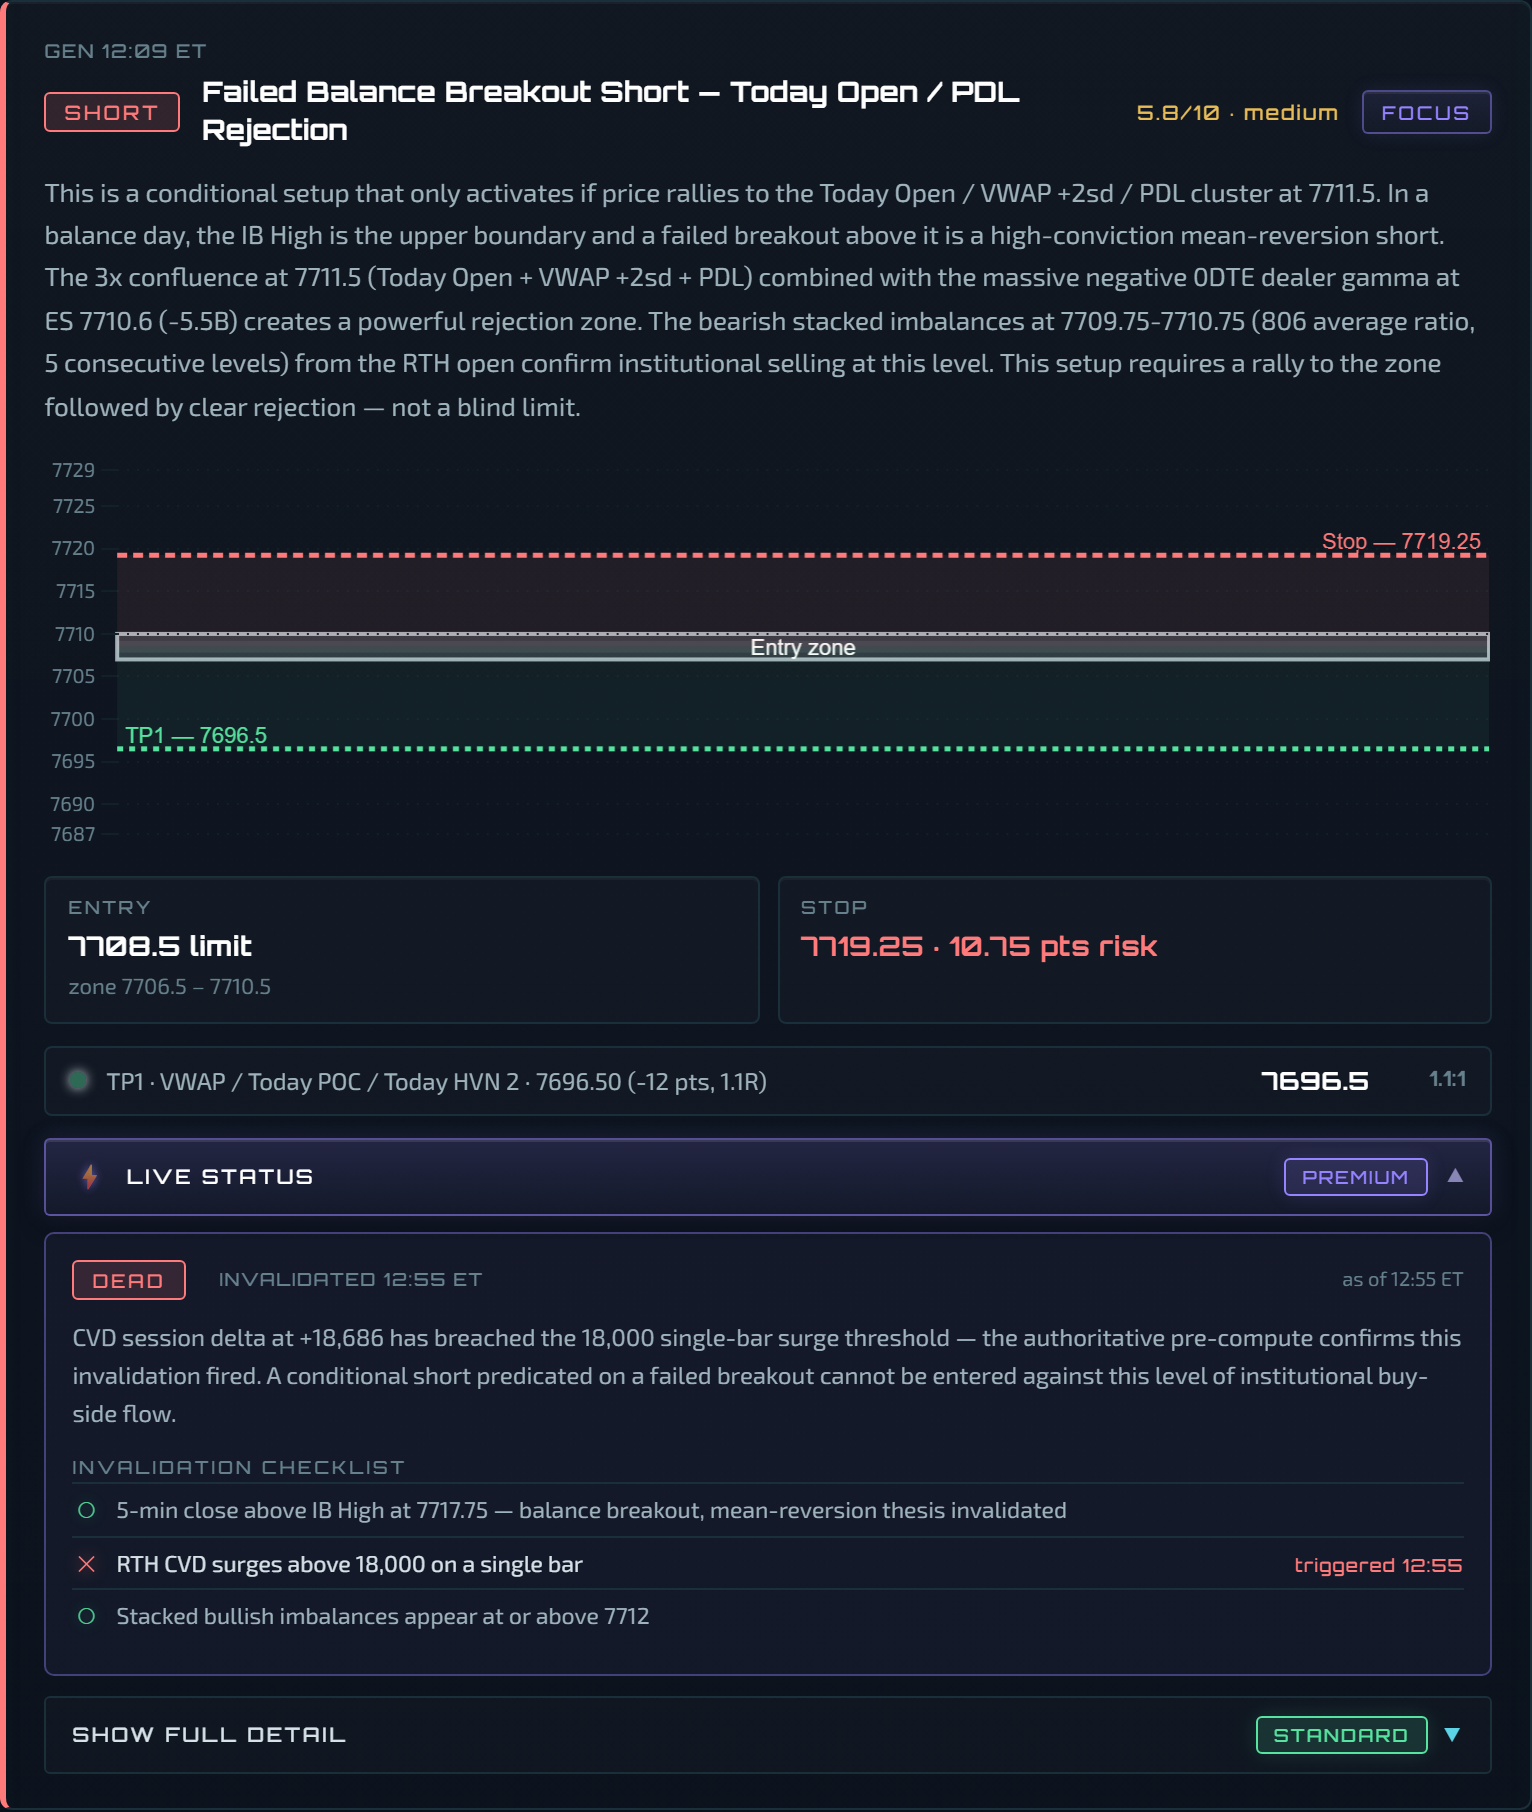
At 12:55 session delta hit +18,686, through the 18,000 condition. DEAD. Institutional buying was overwhelming the range; the fade thesis was wrong, and the monitor said so before price proved it.
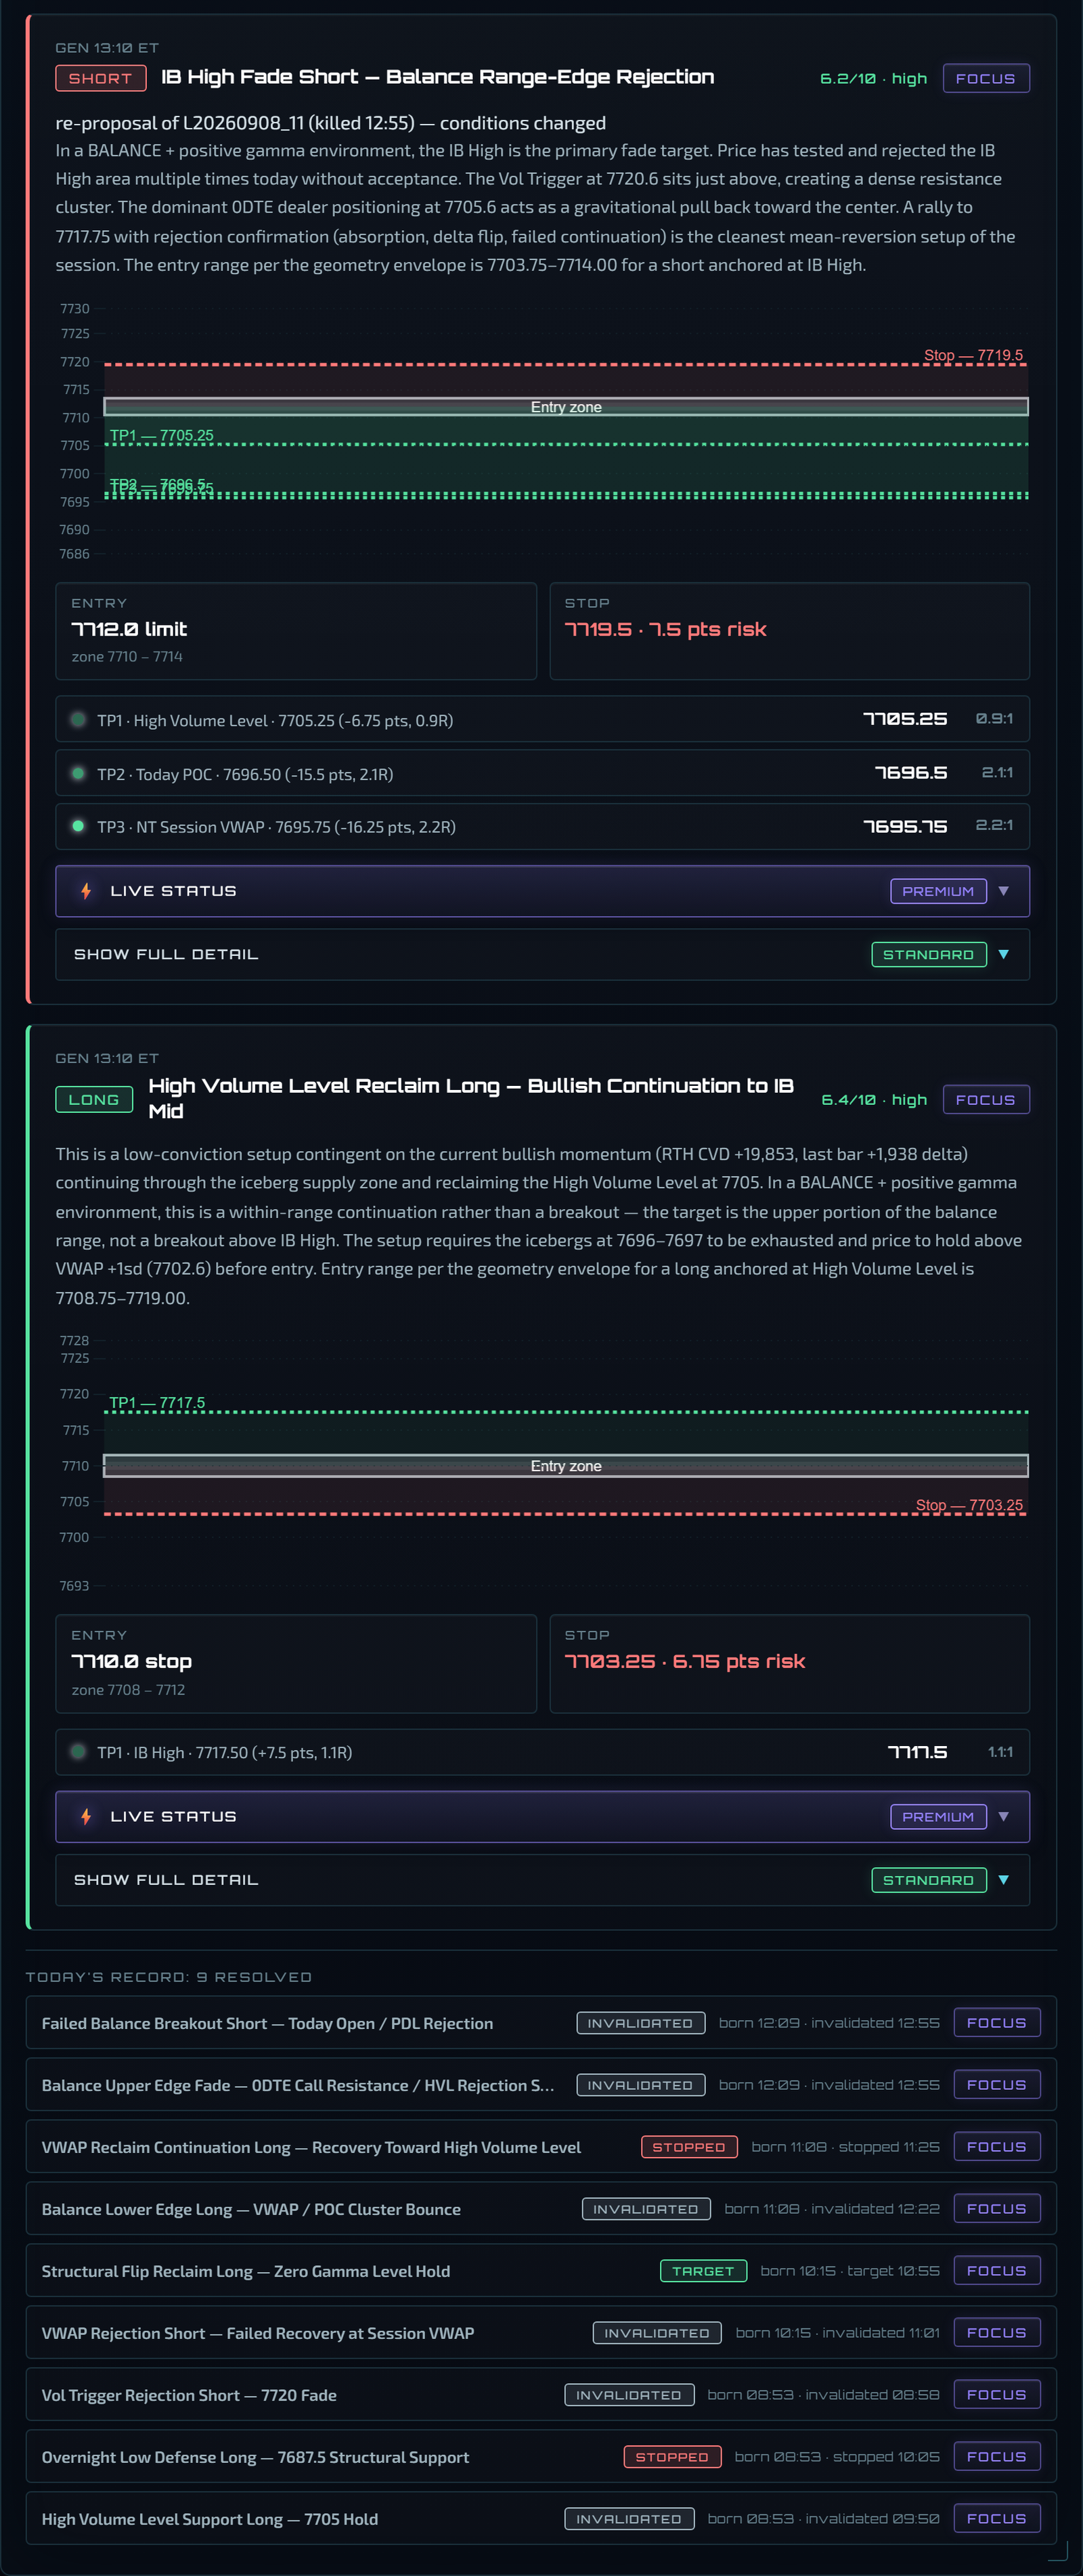
At 13:10 the plan proposed a different short at the IB high with different conditions. That's a new card with a provenance note, not a revival of the dead one. Treat it on its own merits.
A kill is information. Don't average into a dead setup, and don't assume the next card at the same level is the old trade.
8 · Finding your own setups with the tools
The setups are our read. The tools are yours. A simple routine:
 12345
12345- 1Wall: a big gamma bar under a red or green tag
- 2Flip: the amber tag; regime changes here
- 3Profile edge: where the volume thins
- 4Iceberg: someone is defending this price now
- 5Price against VWAP
- Regime first. Positive gamma → fade walls and profile edges. Negative gamma → trade breaks with the flow. The tile tells you which.
- Find the level. A big gamma bar under a red or green tag is a level dealers defend. A composite tag (
+2) is where several things agree. An iceberg band is proof someone is defending it right now. - Confirm with flow. Price at support with CVD rising and hedging flow turning up is a long worth taking. Price at support with CVD falling is a level about to break.
- Check momentum. A zero-cross on the session path near your level is timing.
- Size to the stop. Use the Risk framework: stop at the far side of the level, size so the stop is your max risk, first target at the next tag.
- Write your own checklist. What would prove you wrong? The monitor's conditions are a template: a 5-min close through the level, CVD through a threshold, stacked imbalances against you.
 1234
1234- 1Put wall: the largest positive gamma below price
- 2Price tests the wall
- 3CVD holds while price makes a lower low: divergence
- 4First target: the next tag above
9 · The Pre-Market Briefing
 1234567
- 1Bias with above / primary / invalidates
- 2ES last, Net GEX, VIX, expected move, first plan
- 3Key levels today with dealer gamma bars; CURRENT is price
- 4Market outlook
- 5Scenarios: bullish and bearish paths
- 6Watching for: the first-hour checklist
- 7Economic calendar
- Bias: bullish / bearish / neutral with the "above / primary / invalidates" lines: where the bias holds, what to look for, what breaks it.
- ES last · Net GEX · VIX · Expected move · First plan: the numbers behind the day.
- Key levels today: each level with its tag colour and a dealer gamma bar beside it (blue positive, crimson negative). The CURRENT row is price.
+1on a tag means a composite. Pre-open you'll seeGlobex OpenandON VWAP(the overnight versions) because RTH levels don't exist yet. - Market outlook: the narrative.
- Scenarios: the bullish and bearish paths, each with the levels that confirm it.
- Watching for: the checklist for the first hour.
- Economic calendar: today's releases.
10 · The End-of-Day Recap
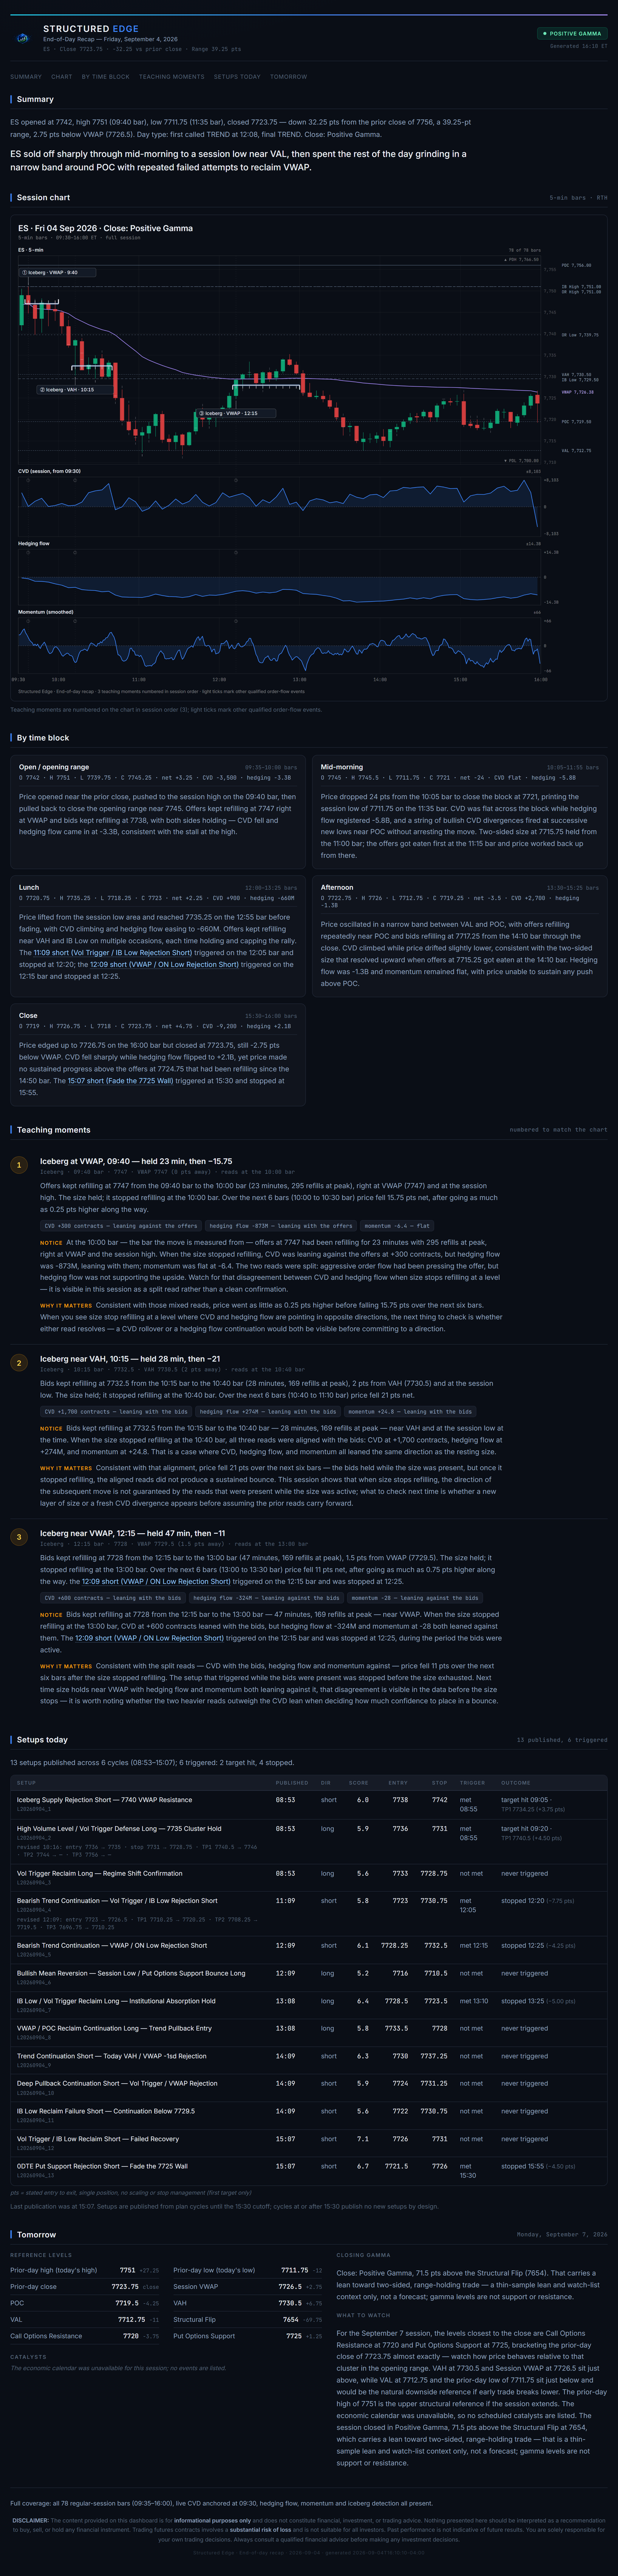
- Summary: open, high, low, close, range, day type, and the story in two sentences.
- Session chart: 5-min candles with VWAP, level tags on the right, CVD, hedging flow, momentum panels, and the ①②③ markers.
- By time block: what happened in each part of the day and which setups triggered.
- Teaching moments: the ①②③: an iceberg that held, a failed continuation, a divergence, with what to notice and why it matters.
- Setups today: every setup published, when, direction, score, entry/stop, whether it triggered, outcome.
- Tomorrow: reference levels with distance from the close, closing gamma, what to watch, catalysts.
The recap page follows your theme choice. The dashboard's recap card shows the same chart and the ①②③ headlines.
11 · The NinjaTrader indicatorAll tiers
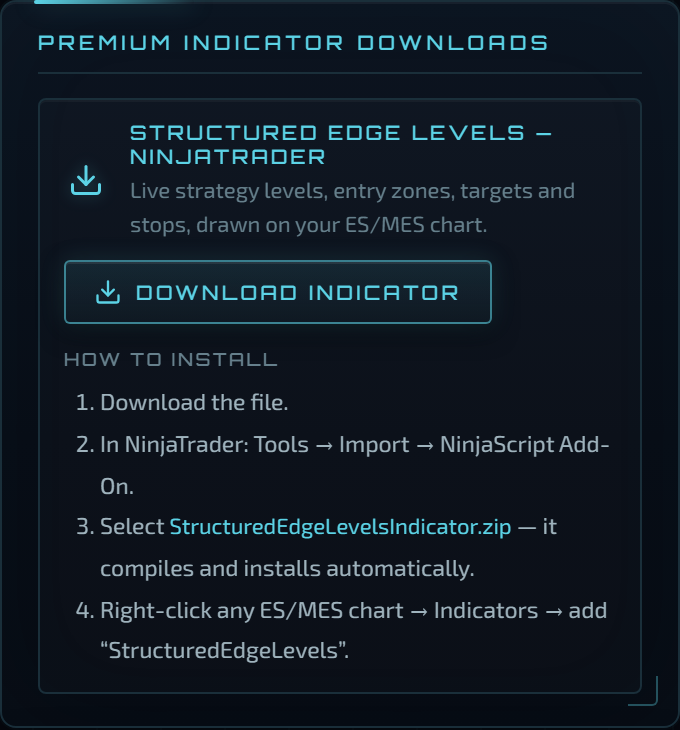
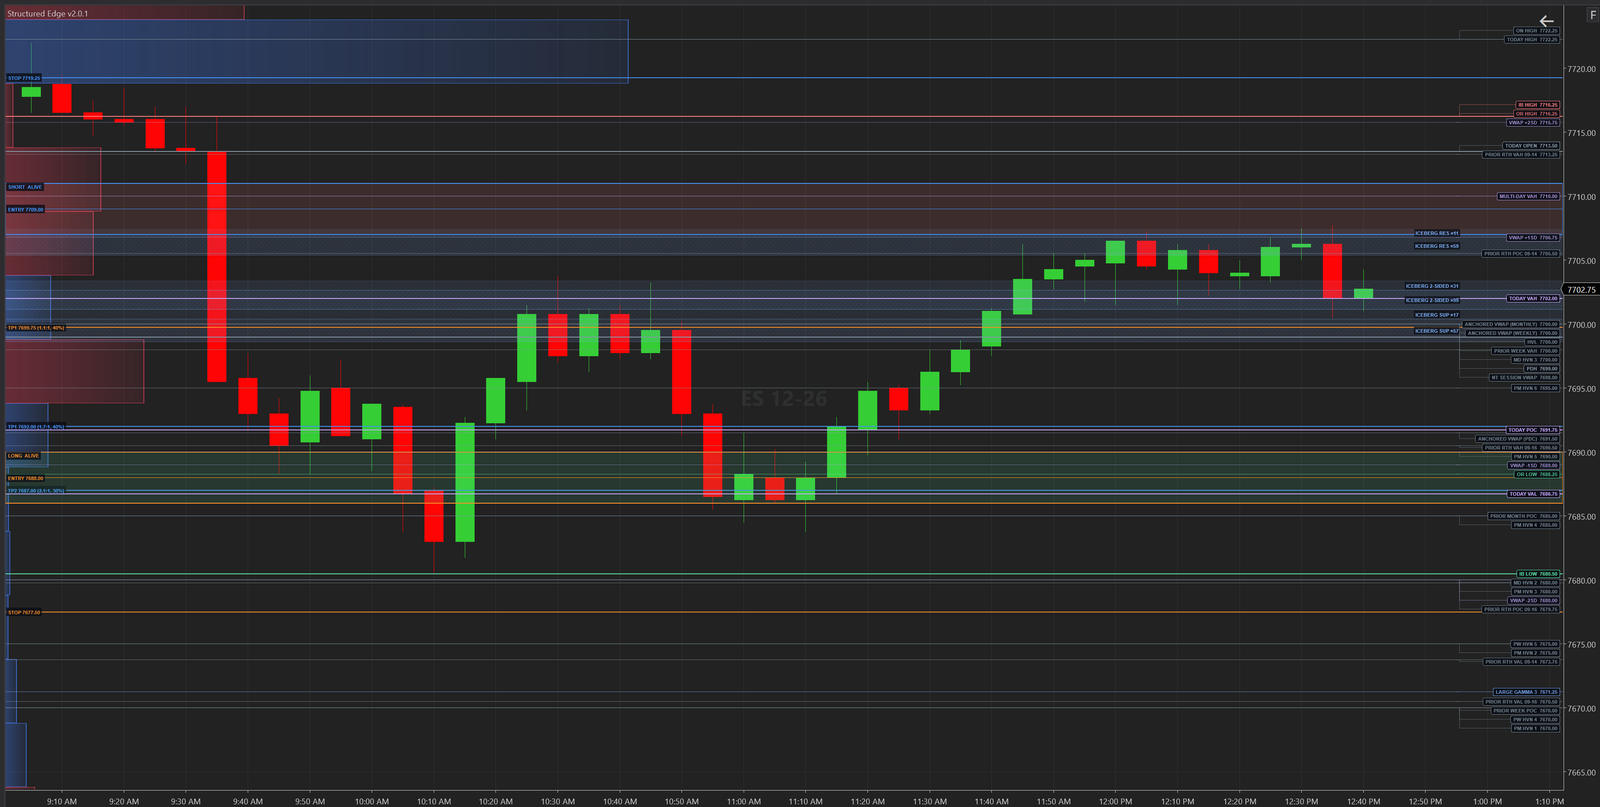
- Download the zip from the card.
- NinjaTrader → Tools → Import → NinjaScript Add-On → select the zip. If asked to overwrite an existing
StructuredEdgeLevels, choose Yes: that upgrades your copy. - Right-click an ES or MES chart → Indicators → add StructuredEdgeLevels.
- Properties: level groups on/off, tiers, Longs / Shorts / Dead setups, gamma bars (side, length %, All/0DTE), iceberg zones. Levels refresh every few minutes; icebergs every minute.
ES prices draw identically on MES. Version shows in the indicator's properties header.
12 · On your phone
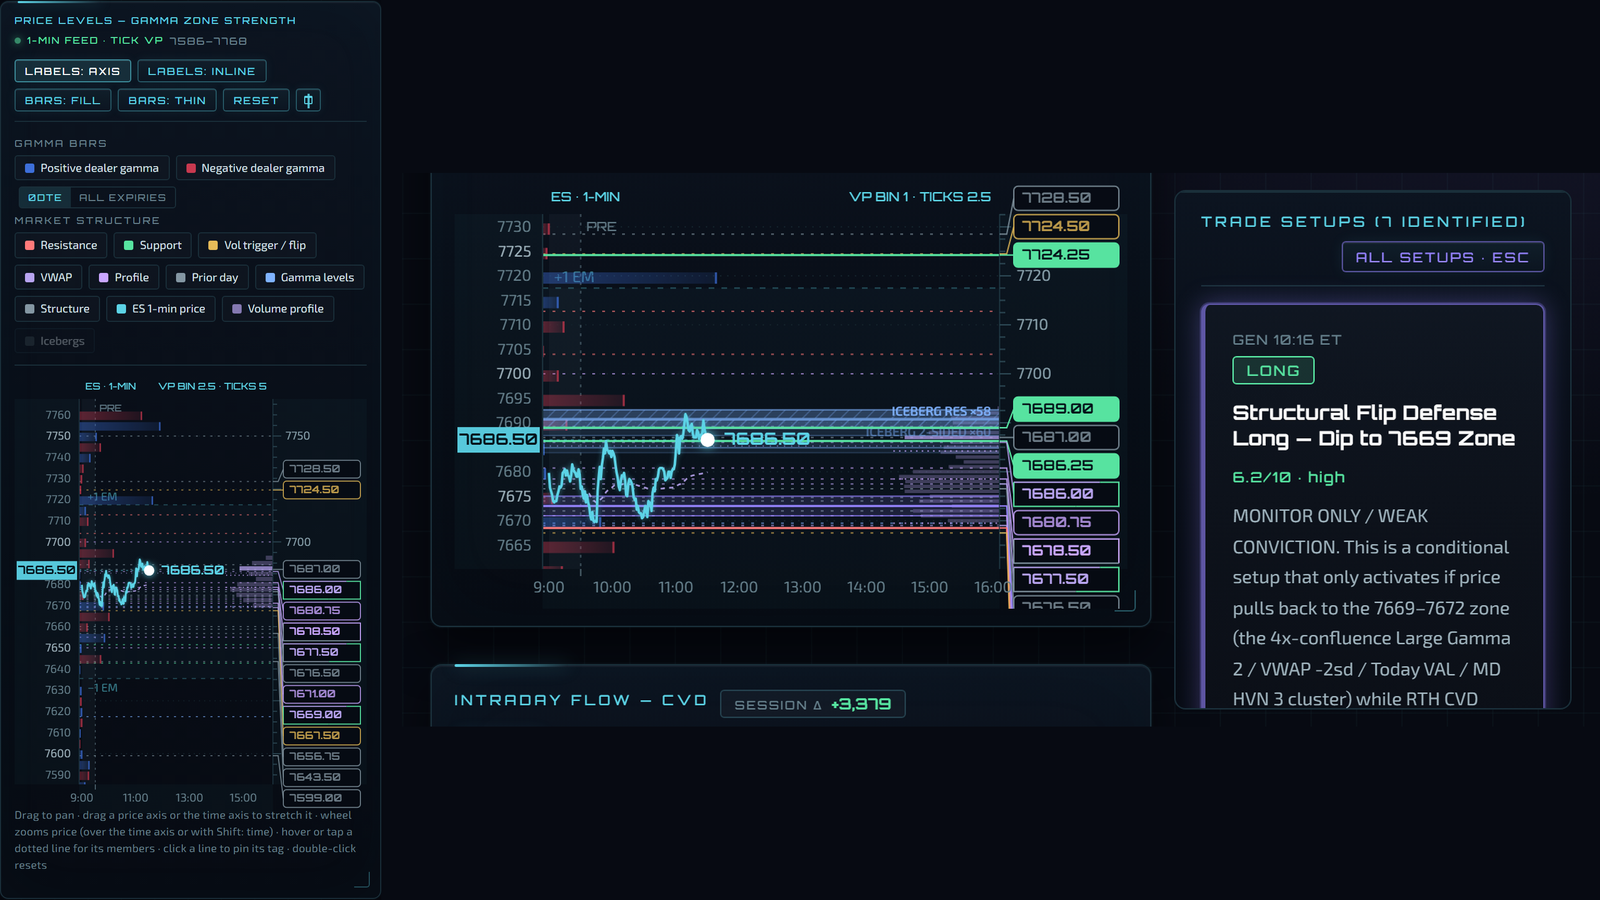
- One finger scrolls the page; drag sideways pans time. Hold a moment, then drag, to pan freely.
- Two fingers: drag to pan, pinch to zoom the axis you spread along.
- Drag on the price axis or the time axis to stretch just that axis. Double-tap to reset.
- Tags show price only; tap a line for its name. Icebergs are off by default on small screens; turn them on from the key.
- Landscape gives the zone chart room; Focus works in both.
13 · Glossary
- Gamma
- how fast dealers' hedges must change as price moves. Positive gamma: dealers buy dips and sell rips (moves dampen). Negative gamma: dealers chase (moves extend).
- Dealer gamma by strike
- where that gamma sits. Big bars are where hedging concentrates.
- Net GEX
- total dealer gamma exposure, in dollars.
- Vol Trigger
- The last major level of positive dealer gamma above the structural flip. Above it, dealer hedging damps moves. Below it, realized volatility expands.
- Structural Flip
- The price where aggregate dealer gamma crosses zero. Below it dealers are net short gamma and hedging amplifies moves.
- Transition zone
- Price is below the Vol Trigger but above the structural flip. Dealers still hold net positive gamma, but the last major support above the flip has been lost. Expect wider ranges than above the Trigger; continuation is more likely than a clean fade.
- Call wall / put wall
- the strikes with the largest positive gamma above and below price. Price tends to stall there.
- 0DTE
- options expiring today. 0DTE walls are strong intraday magnets that reset daily.
- Options resistance / support
- call- or put-driven options-structure levels from the options book.
- Key gamma strike / large gamma
- the biggest individual gamma strikes.
- VWAP
- volume-weighted average price for the session; ±1sd/±2sd bands. ON VWAP: the overnight version, shown pre-open.
- POC / VAH / VAL
- point of control (most volume) and the value area high/low (70% of volume). Multi-day versions use several sessions.
- HVN / LVN
- high- and low-volume nodes in the profile.
- OR / IB
- opening range (first 6 minutes) and initial balance (first hour). IB Ext: extensions of the IB.
- PDH / PDL / PDC
- prior-day high, low, close. ON High / ON Low: overnight.
- Globex Open
- the 18:00 ET session open; Today Open: the 09:30 RTH open.
- 1D Max / 1D Min
- the day's expected extremes from the implied move.
- Expected move (EM)
- the options-implied one-day move, in points.
- CVD
- cumulative volume delta: aggressive buys minus aggressive sells since 09:30.
- Hedging flow / Hedging Impact
- the direction and size of dealer hedging in real time.
- Momentum
- a smoothed order-flow read; the gauge is now, the path is the session.
- Iceberg
- a large resting order that reloads (refills) as it's hit. Refills: how many times. Zone: a cluster of nearby detections.
- Confluence score
- how many independent signals agree, weighted.
- ALIVE / DORMANT / DEAD / STOPPED / TARGET
- see section 5.
- Lineage · revision · re-proposal
- a setup's identity through the day; a tightened version; a new setup with changed conditions after a kill.
- Invalidation
- a condition that, if met, kills the setup. Evaluated by the monitor.
- Stated risk / R
- the distance from entry to the published stop, as the unit.
- Day type
- BALANCE (rotation between levels) or TREND, called at 12:08 and confirmed at the close.
- OPEX
- options expiration (monthly third Friday, quarterly).
- IV / IV30
- implied volatility, 30-day.
14 · FAQ
- When does the plan publish?Briefing ~08:50, first plan 10:15, then hourly. Setups and status refresh every few minutes; the chart every minute.
- Why do some levels change label after the open?Pre-open we show overnight versions (Globex Open, ON VWAP). Once RTH forms, the real ones take over.
- A setup says STOPPED but the narrative used to say open. Which is right?STOPPED. Terminal outcomes come from one source now; if you see a mismatch, refresh.
- Can I use MES?Yes, same prices, same levels, a tenth of the size.
- Do I need NinjaTrader?No. The dashboard is the product. The indicator is included with every subscription for those who chart in NinjaTrader.
- Why did a dead setup come back at the same level?It didn't. A new card with the re-proposal note is a different setup with different conditions.
- Standard vs Premium?Standard: the morning briefing, setups published through the day, levels, charts, the end-of-day recap, and the NinjaTrader indicator. Premium adds live status updates bar by bar, the invalidation checklist evaluated live, and a live notice when structure or conditions change.
- I'm new. What should I do first?Read the briefing. Watch one high-score setup without trading it. Then paper-trade one, sizing to the Risk framework.
- Questions?The Structured Edge Discord.